MarketBee
MarketBee is a software and consulting company specializing in construction materials. MarketBee helps aggregates and concrete producers improve their pricing strategies and revenue management by sharing its decades-long expertise in the industry and offering competitive digital products.
All CustomersWeb Development
Redwerk developed a web-based data visualization tool seamlessly integrated with Microsoft Power BI. We combined the power of custom development with existing solutions to meet our client’s budget and deadline. We also thoroughly tested the app throughout the development.
Learn moreLogistics and Transportation
We helped MarketBee develop a comprehensive market assessment tool for the construction materials industry. The app helps companies better understand their market position, identify logistics & transportation hurdles and opportunities, and make effective business decisions.
Challenge
Aggregates producers, the key players in the construction materials industry, face multiple challenges. The industry, though stable, is conservative and slow in adopting digital transformation. This results in a reliance on spreadsheets and outdated software, if any, for market evaluations. The lack of proper data visualization leads to an incomplete understanding of the market, causing missed opportunities that directly affect a company’s profitability.
That’s why MarketBee, formerly KB&G Consulting, set out to solve this problem and hired Redwerk to develop market assessment software. This app would help evaluate aggregates supply and demand, the volume of reserves, and their depletion forecast. It would also compare market shares of different companies, determining if one has a logistics advantage over competitors, and reflect all of that analysis in easy-to-digest reports.
When all market insights are grouped and visualized, aggregates producers can better understand their position, how to appeal to their competitors’ customers, and how to increase their revenue. Construction companies can also benefit from this market assessment tool to find suppliers with the needed geology and lower prices.
Here was our client’s wish-list:
- Usability and Accessibility: the UI must be appealing and comfortable enough for regular use. As per our client’s estimations, creating an initial database and market overview may take from 3 to 6 weeks of daily work with less time-consuming updates throughout the year. This workflow requires high usability and accessibility. Also, an app that is all about data visualization needs to be intuitive and user-friendly.
- Cost-Effective Approach: we needed to optimize the development process by selecting the right technology stack and using existing solutions to deliver a cost-effective solution.
- Real-Time Calculations: the app required on-the-fly data recalculation during input. This would allow users to see immediate results and test various “what-if” scenarios for informed decision-making.
Our job was to develop an easy-to-use web solution that facilitates a granular analysis of aggregates supply and demand.
Solution
Redwerk joined the project at the stage of refining the functional requirements. We developed the entire web app from scratch. Our team took care of creating brand-compliant UI/UX, front- and backend development as well as comprehensive quality assurance.
UI/UX Design
When creating UI/UX designs for MarketBee, we followed the principles of Material Design. Established by Google, this design language is an industry standard for building intuitive, accessible apps with a clean and modern aesthetic.
We presented our client with three distinct UI options, each offering a different layout and element density. Each option came with a detailed explanation highlighting its strengths. The final choice was made by our client’s team of analysts.
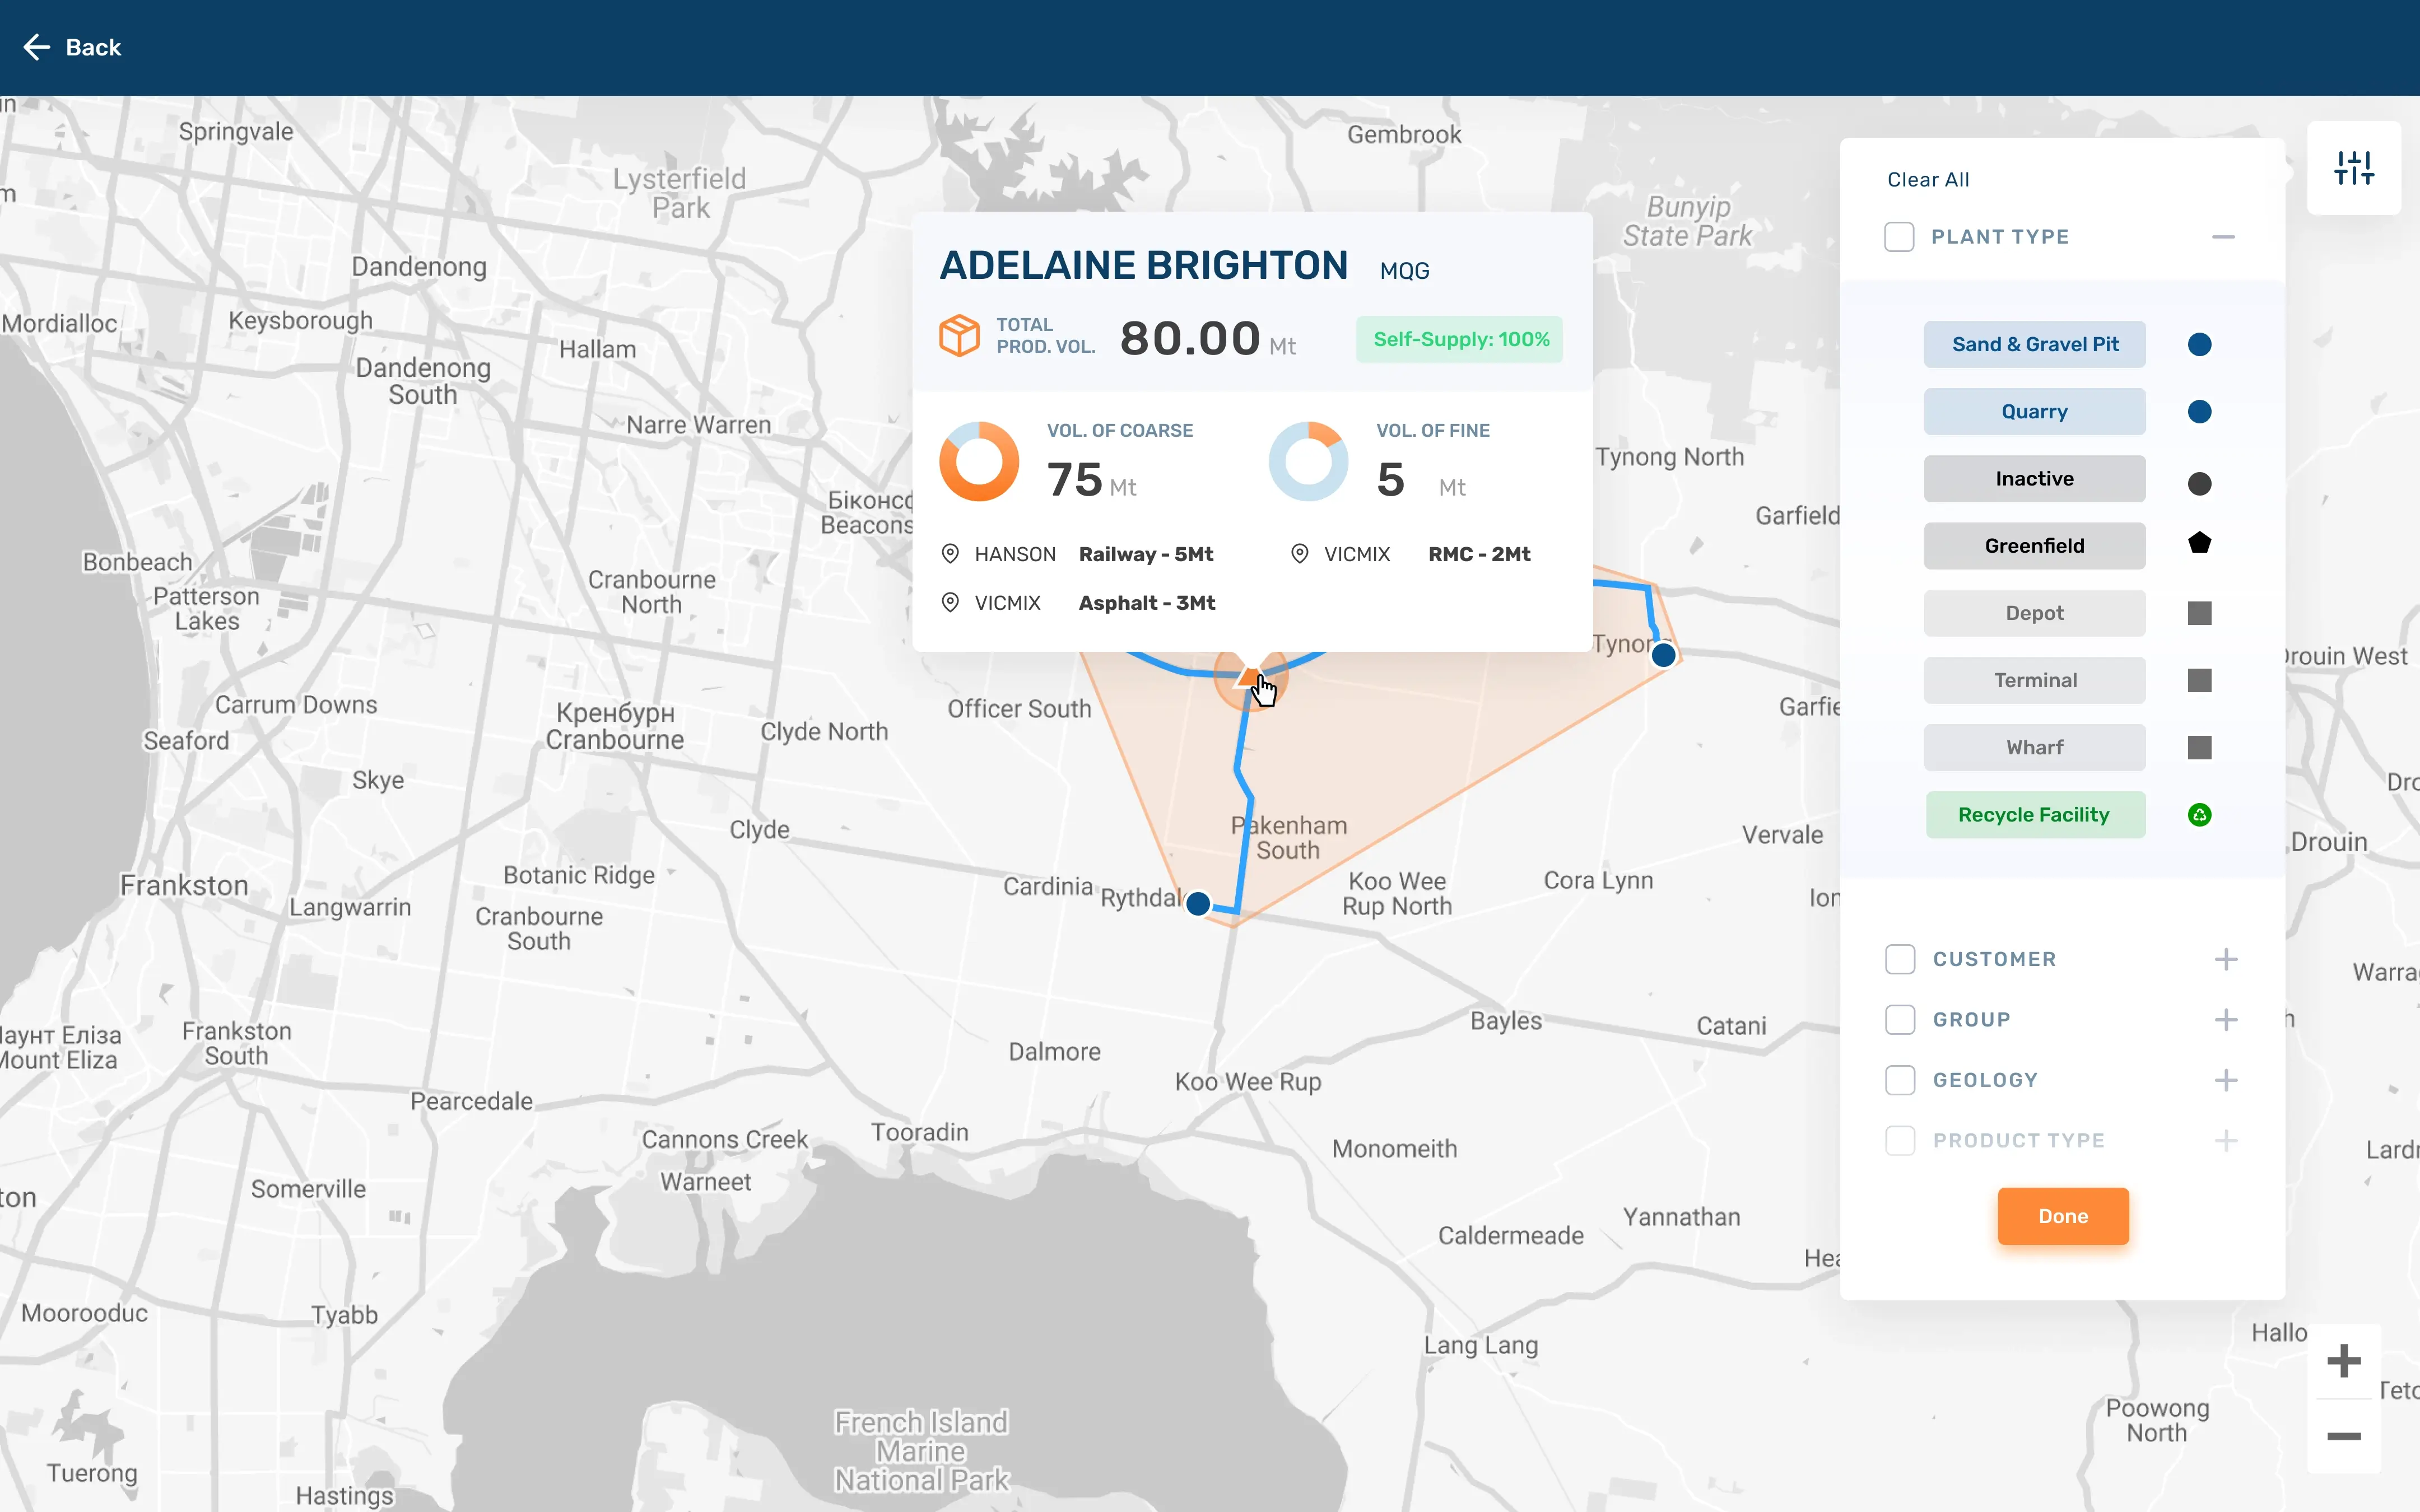
To save costs and shorten the development time, we used existing data visualization tools from Microsoft Power BI. We chose visualizations that best suited the app’s functionality and customized them to integrate with the overall branding.
Whether it’s a lengthy form, a complex graph, or data visualized on a map, we ensured that the user sees familiar elements and interactions. Since there was no lookalike app to follow, we drew inspiration from established design patterns familiar to users from everyday interactions with other apps. This minimized the learning curve and made MarketBee easy to navigate.
Data Visualization
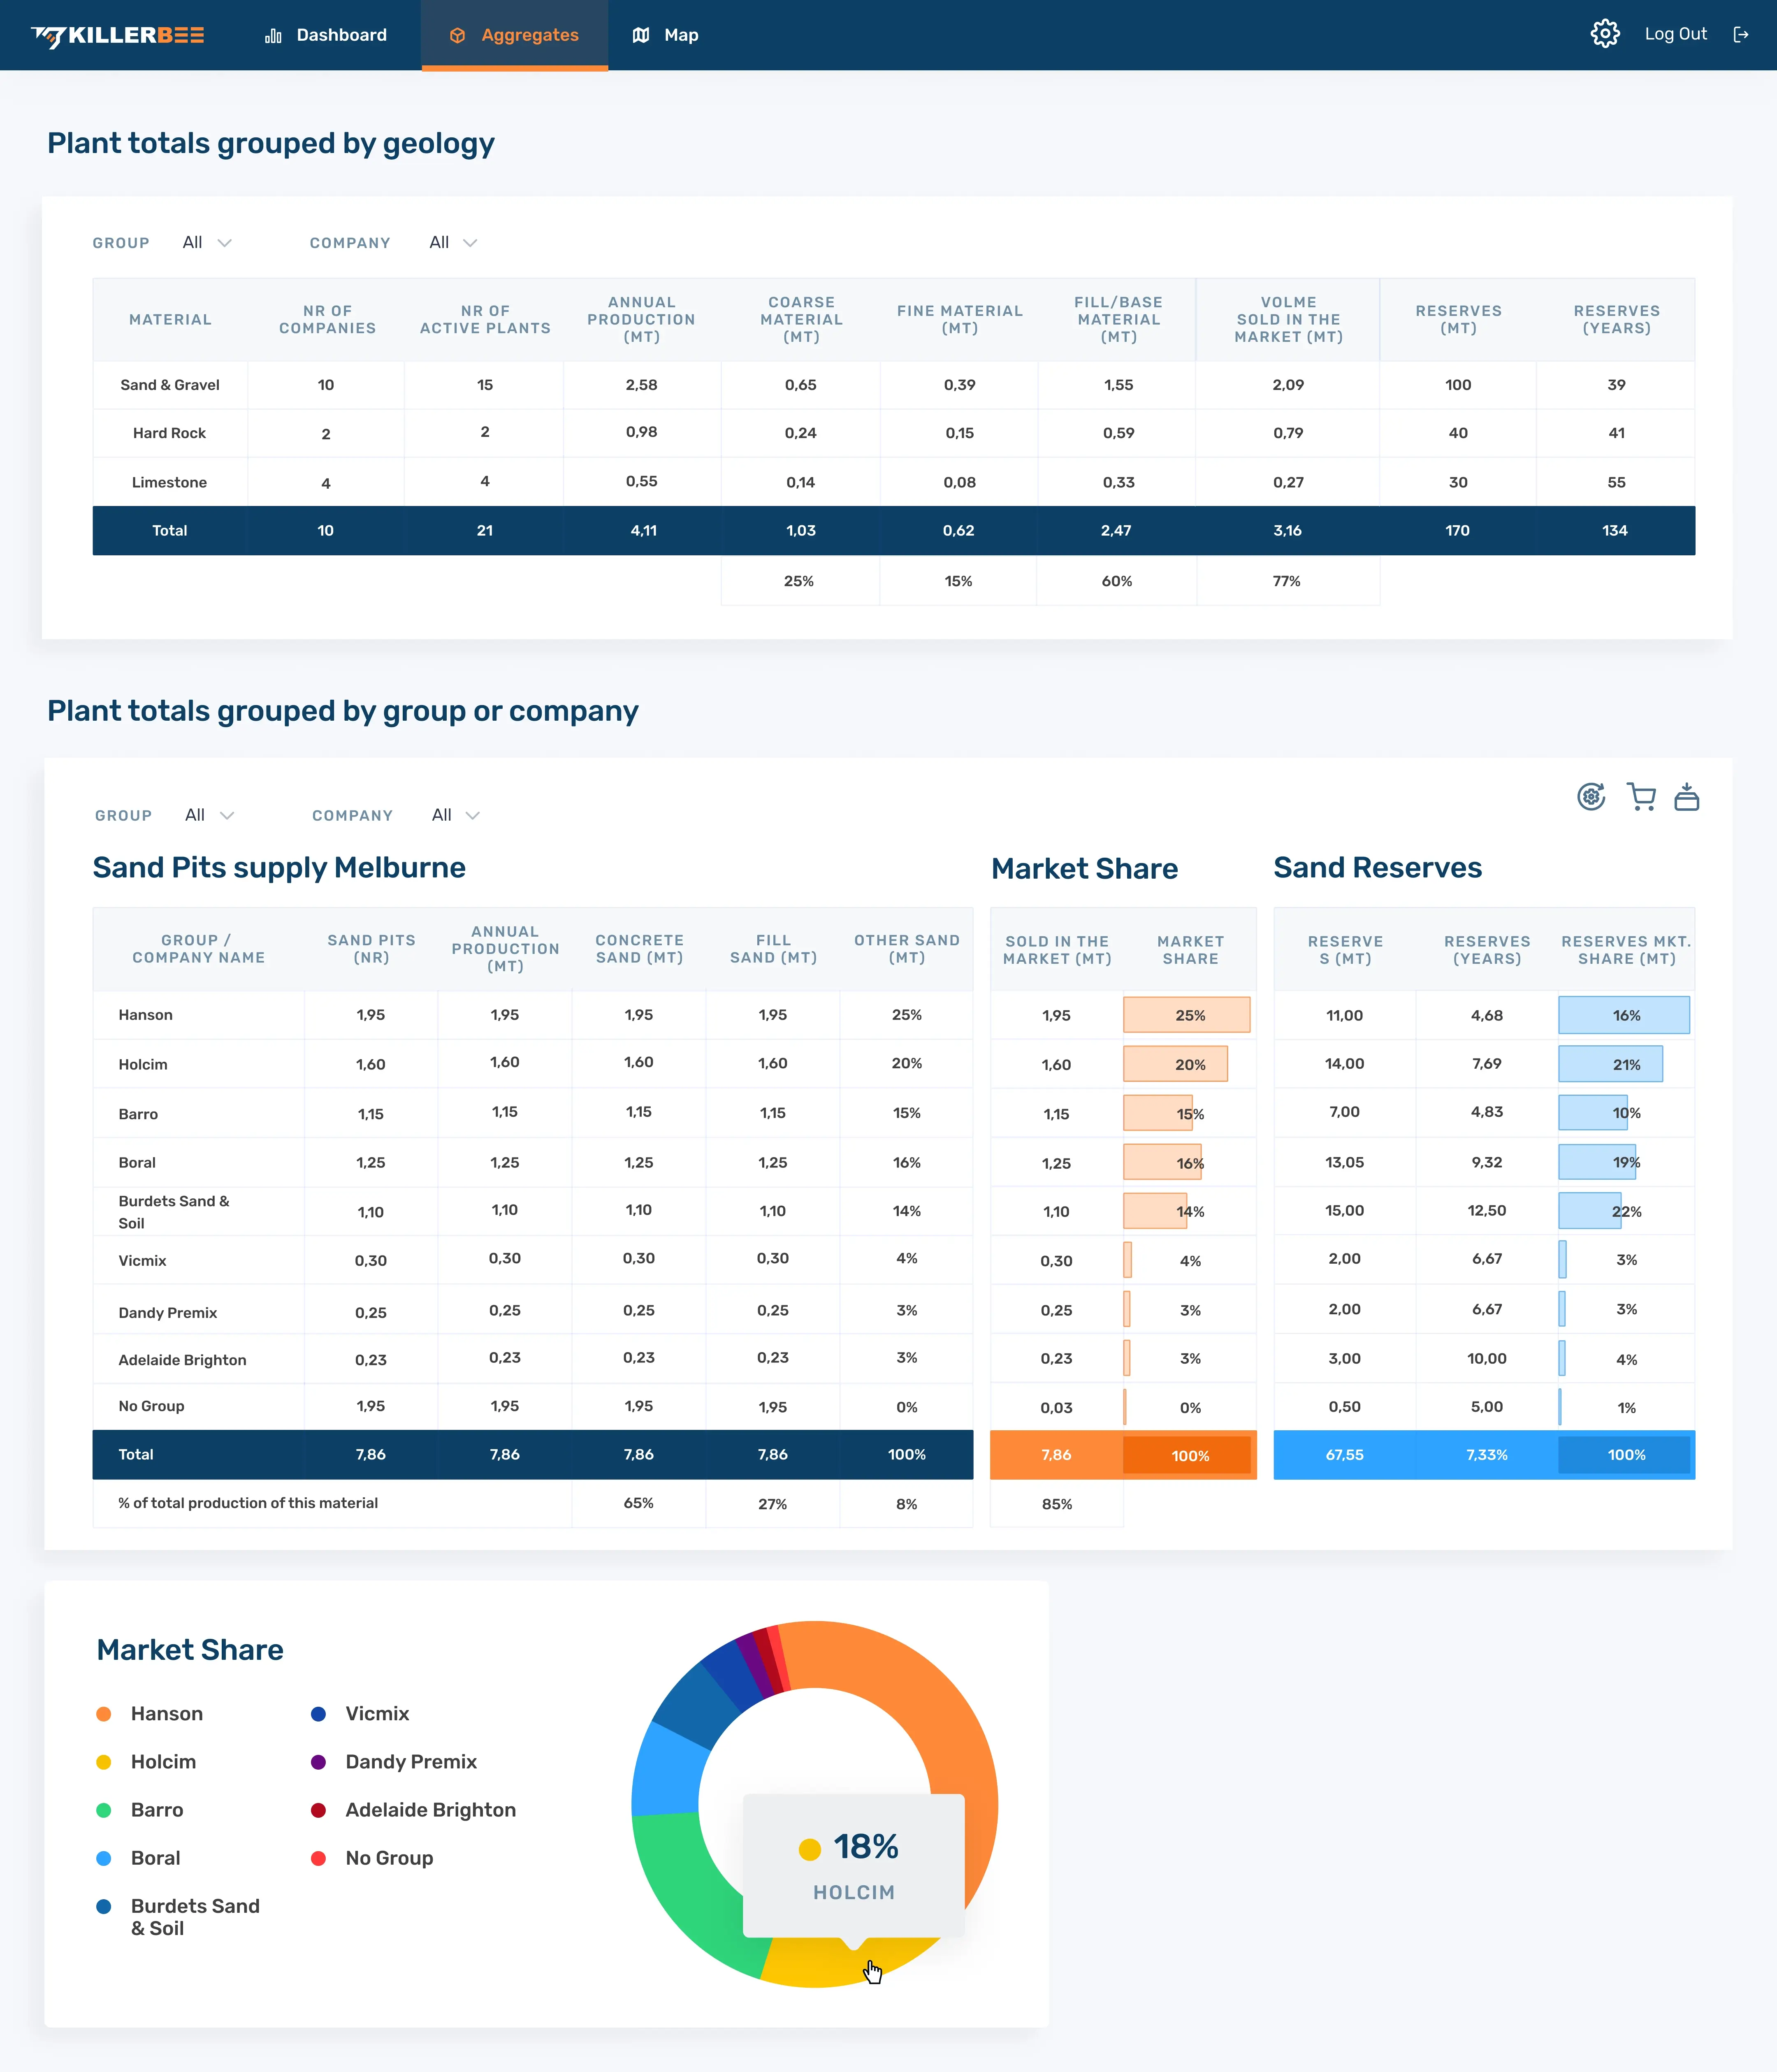
MarketBee’s primary advantage is its powerful data visualization combined with local knowledge and industry-specific analysis. As we mentioned earlier, we integrated the app with Power BI to optimize development time and budget. Power BI offers a vast library of visualizations, including common charts, maps, tables, and interactive visuals. It also comes with a robust set of data import features.
Power BI offers a high degree of customization, allowing one to tailor data presentation and functionalities to match their web app’s needs. However, as with any readily available solution, it has its limitations, specifically regarding data transformation and historical data. That means we had to write custom data processors to implement certain graphs.
Core Functionalities
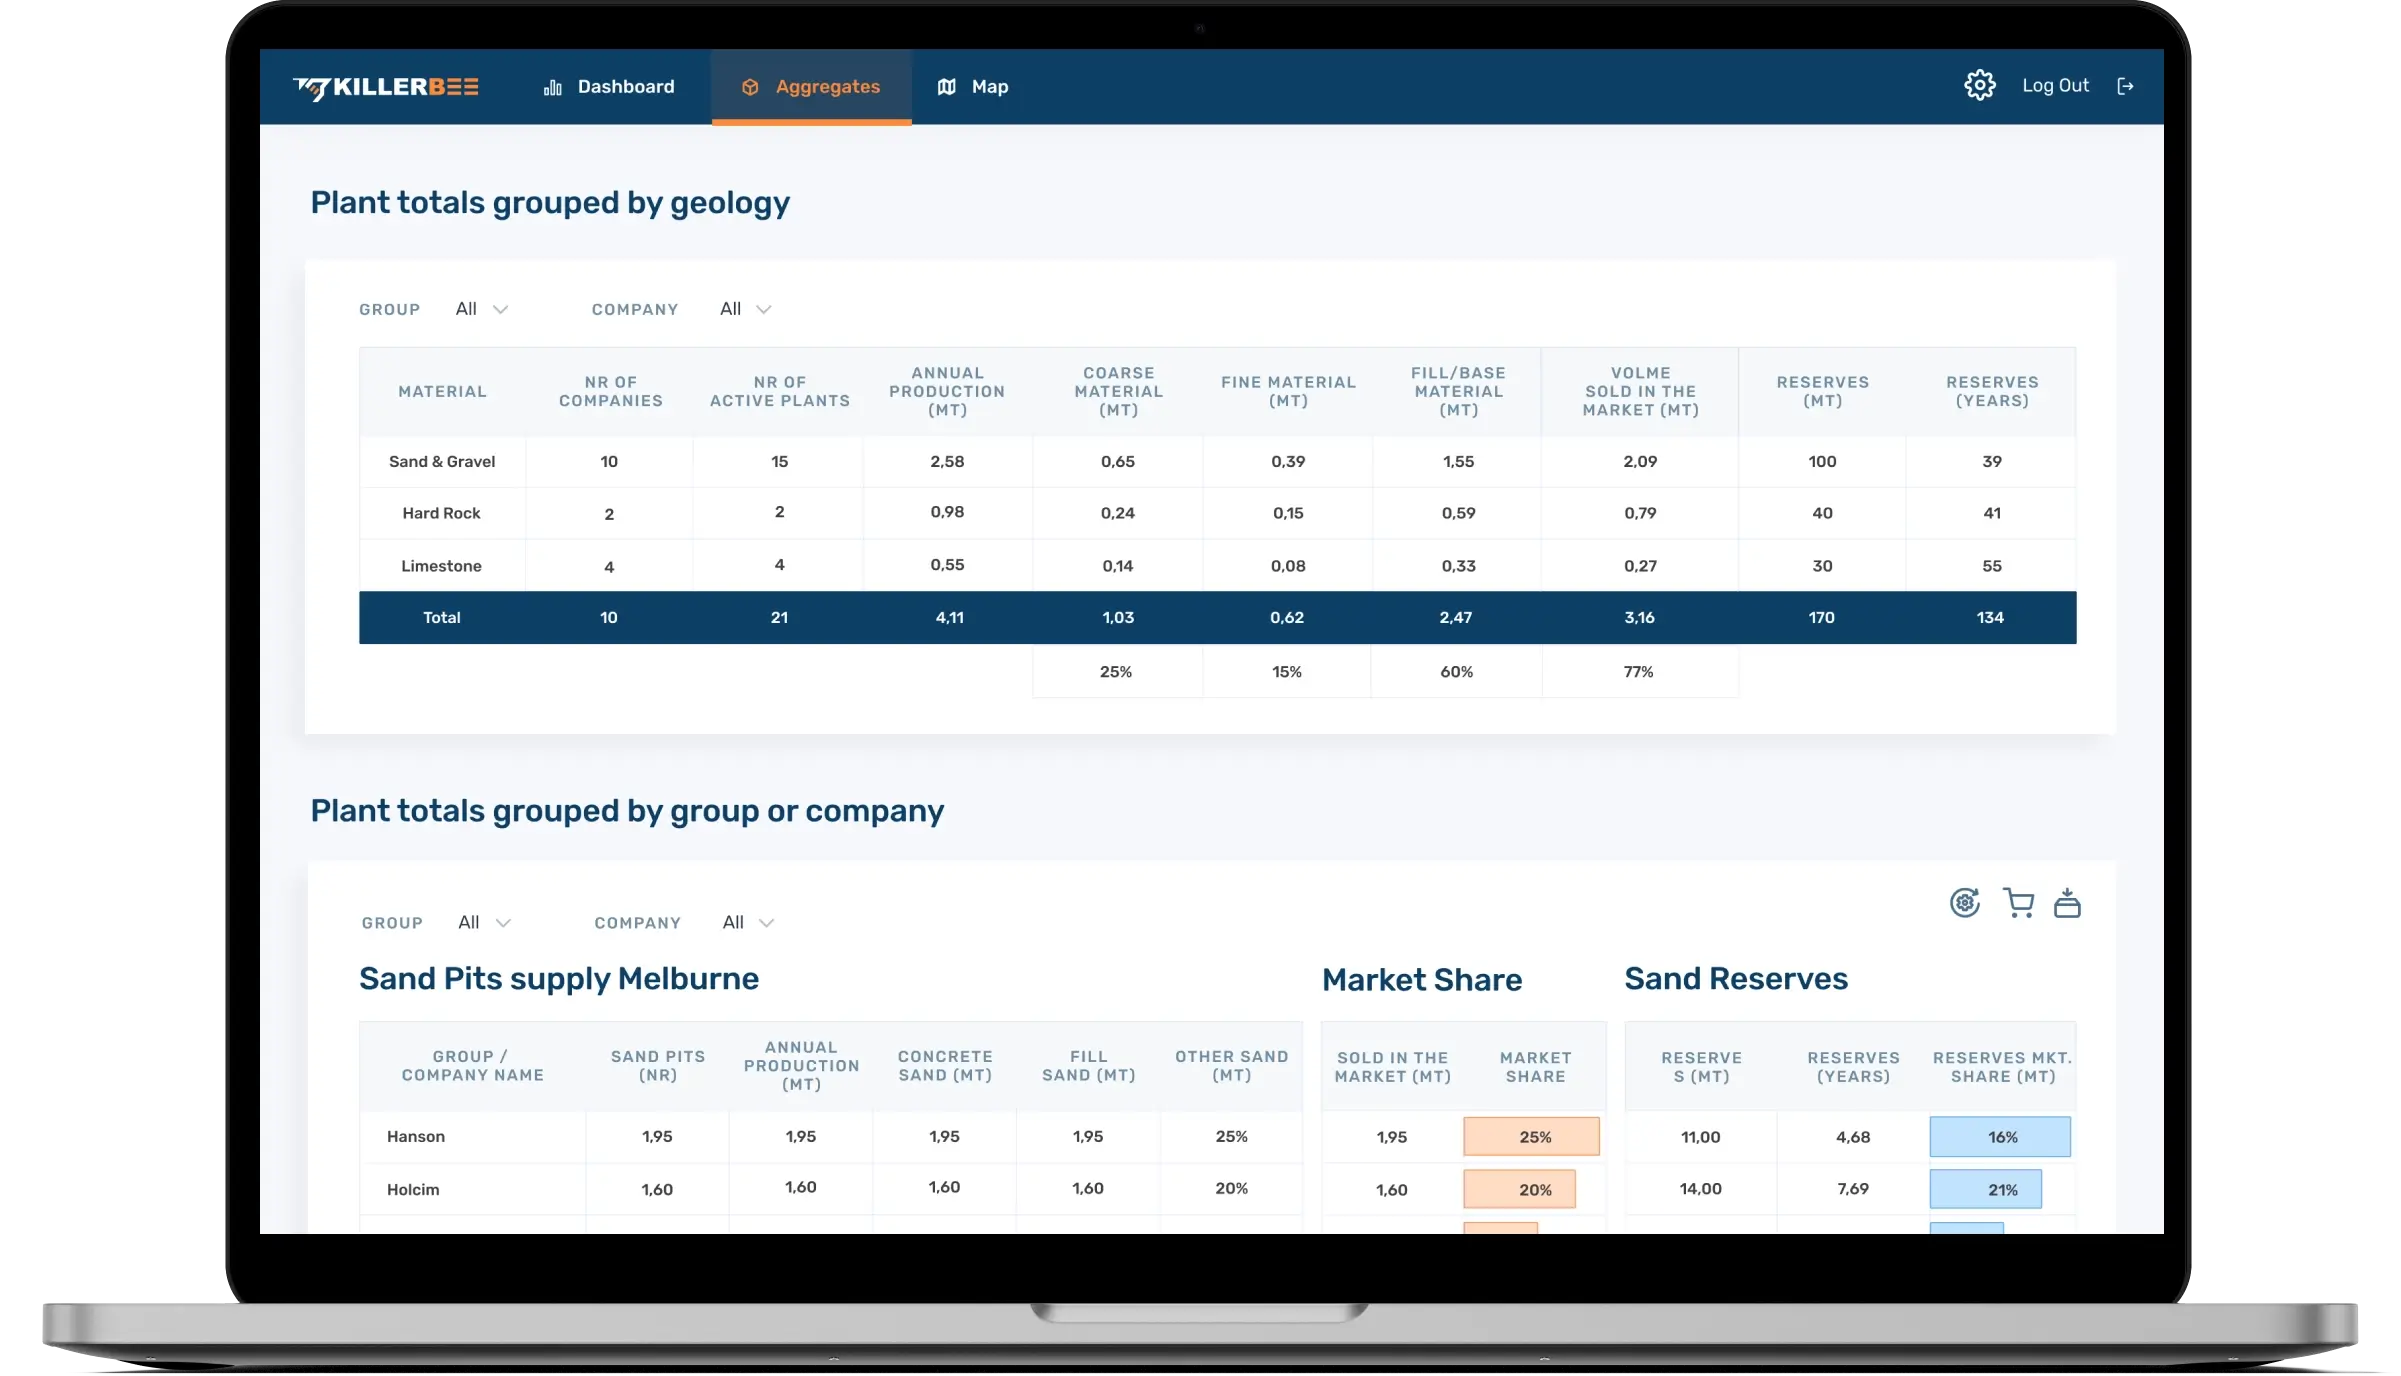
MarketBee allows creating and sharing practical market overviews and interactive maps suitable for making both tactical and strategic business decisions. Let’s go over some functionalities present in MarketBee:
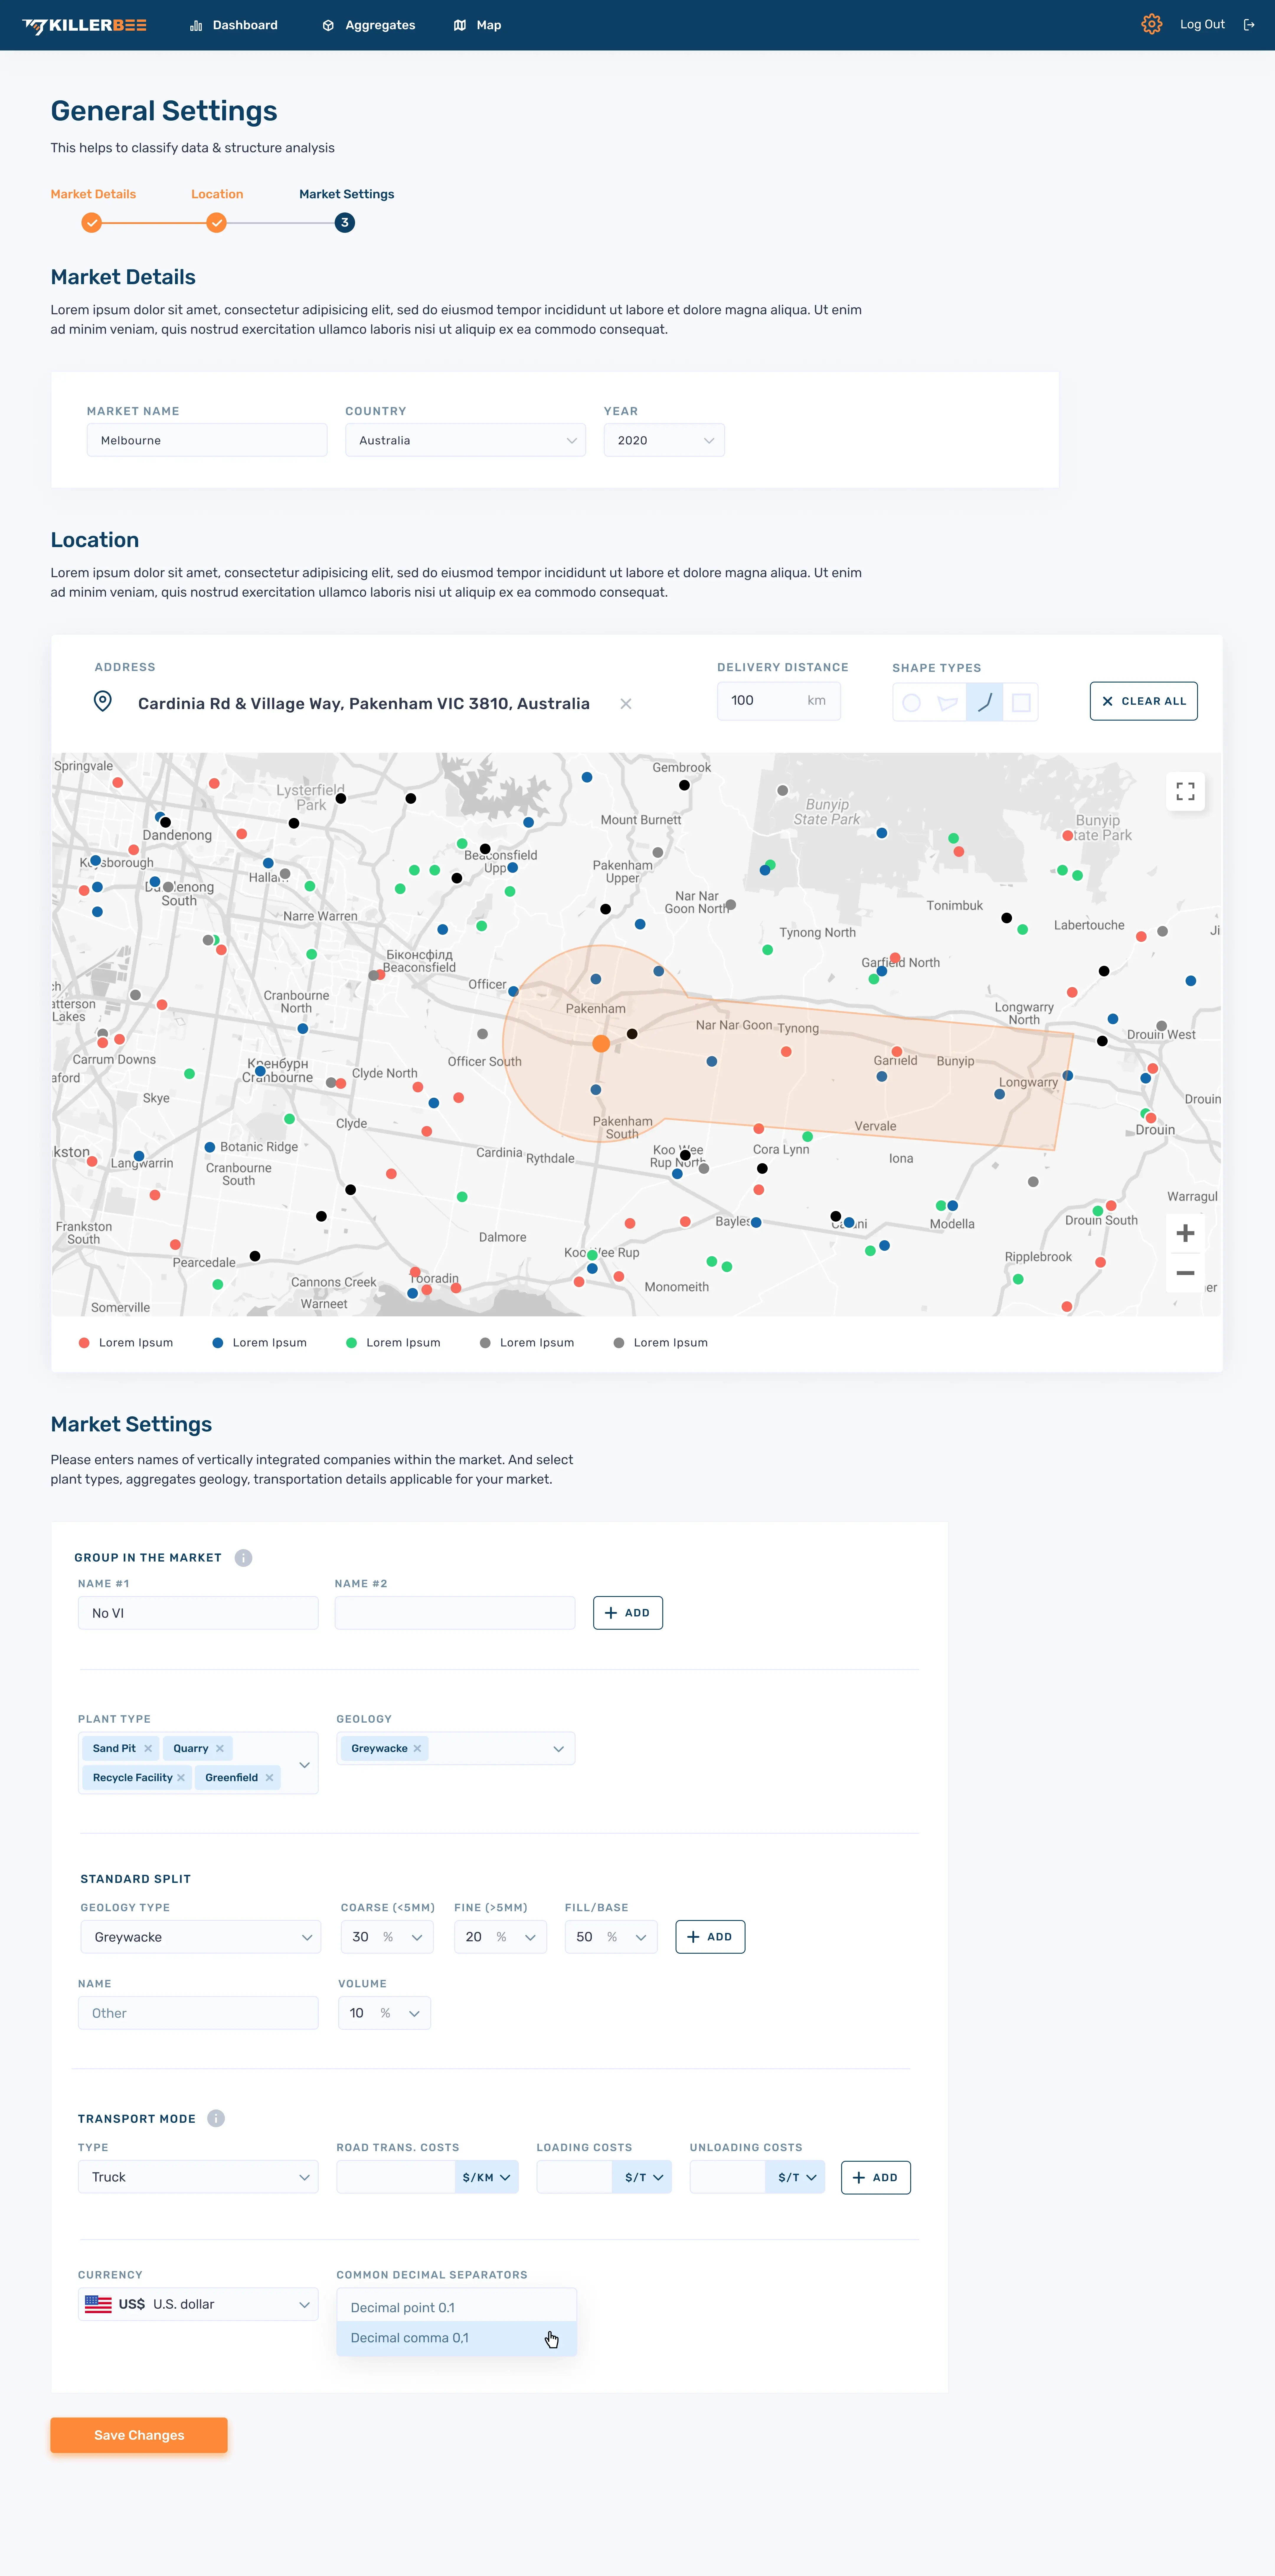
- General Settings. Here the user inputs information that will help classify data and structure their analysis. The user provides a market name, the year for which data is collected, selects suitable plant types (like quarry, sand pit, or recycle facility), and defines the market boundary.
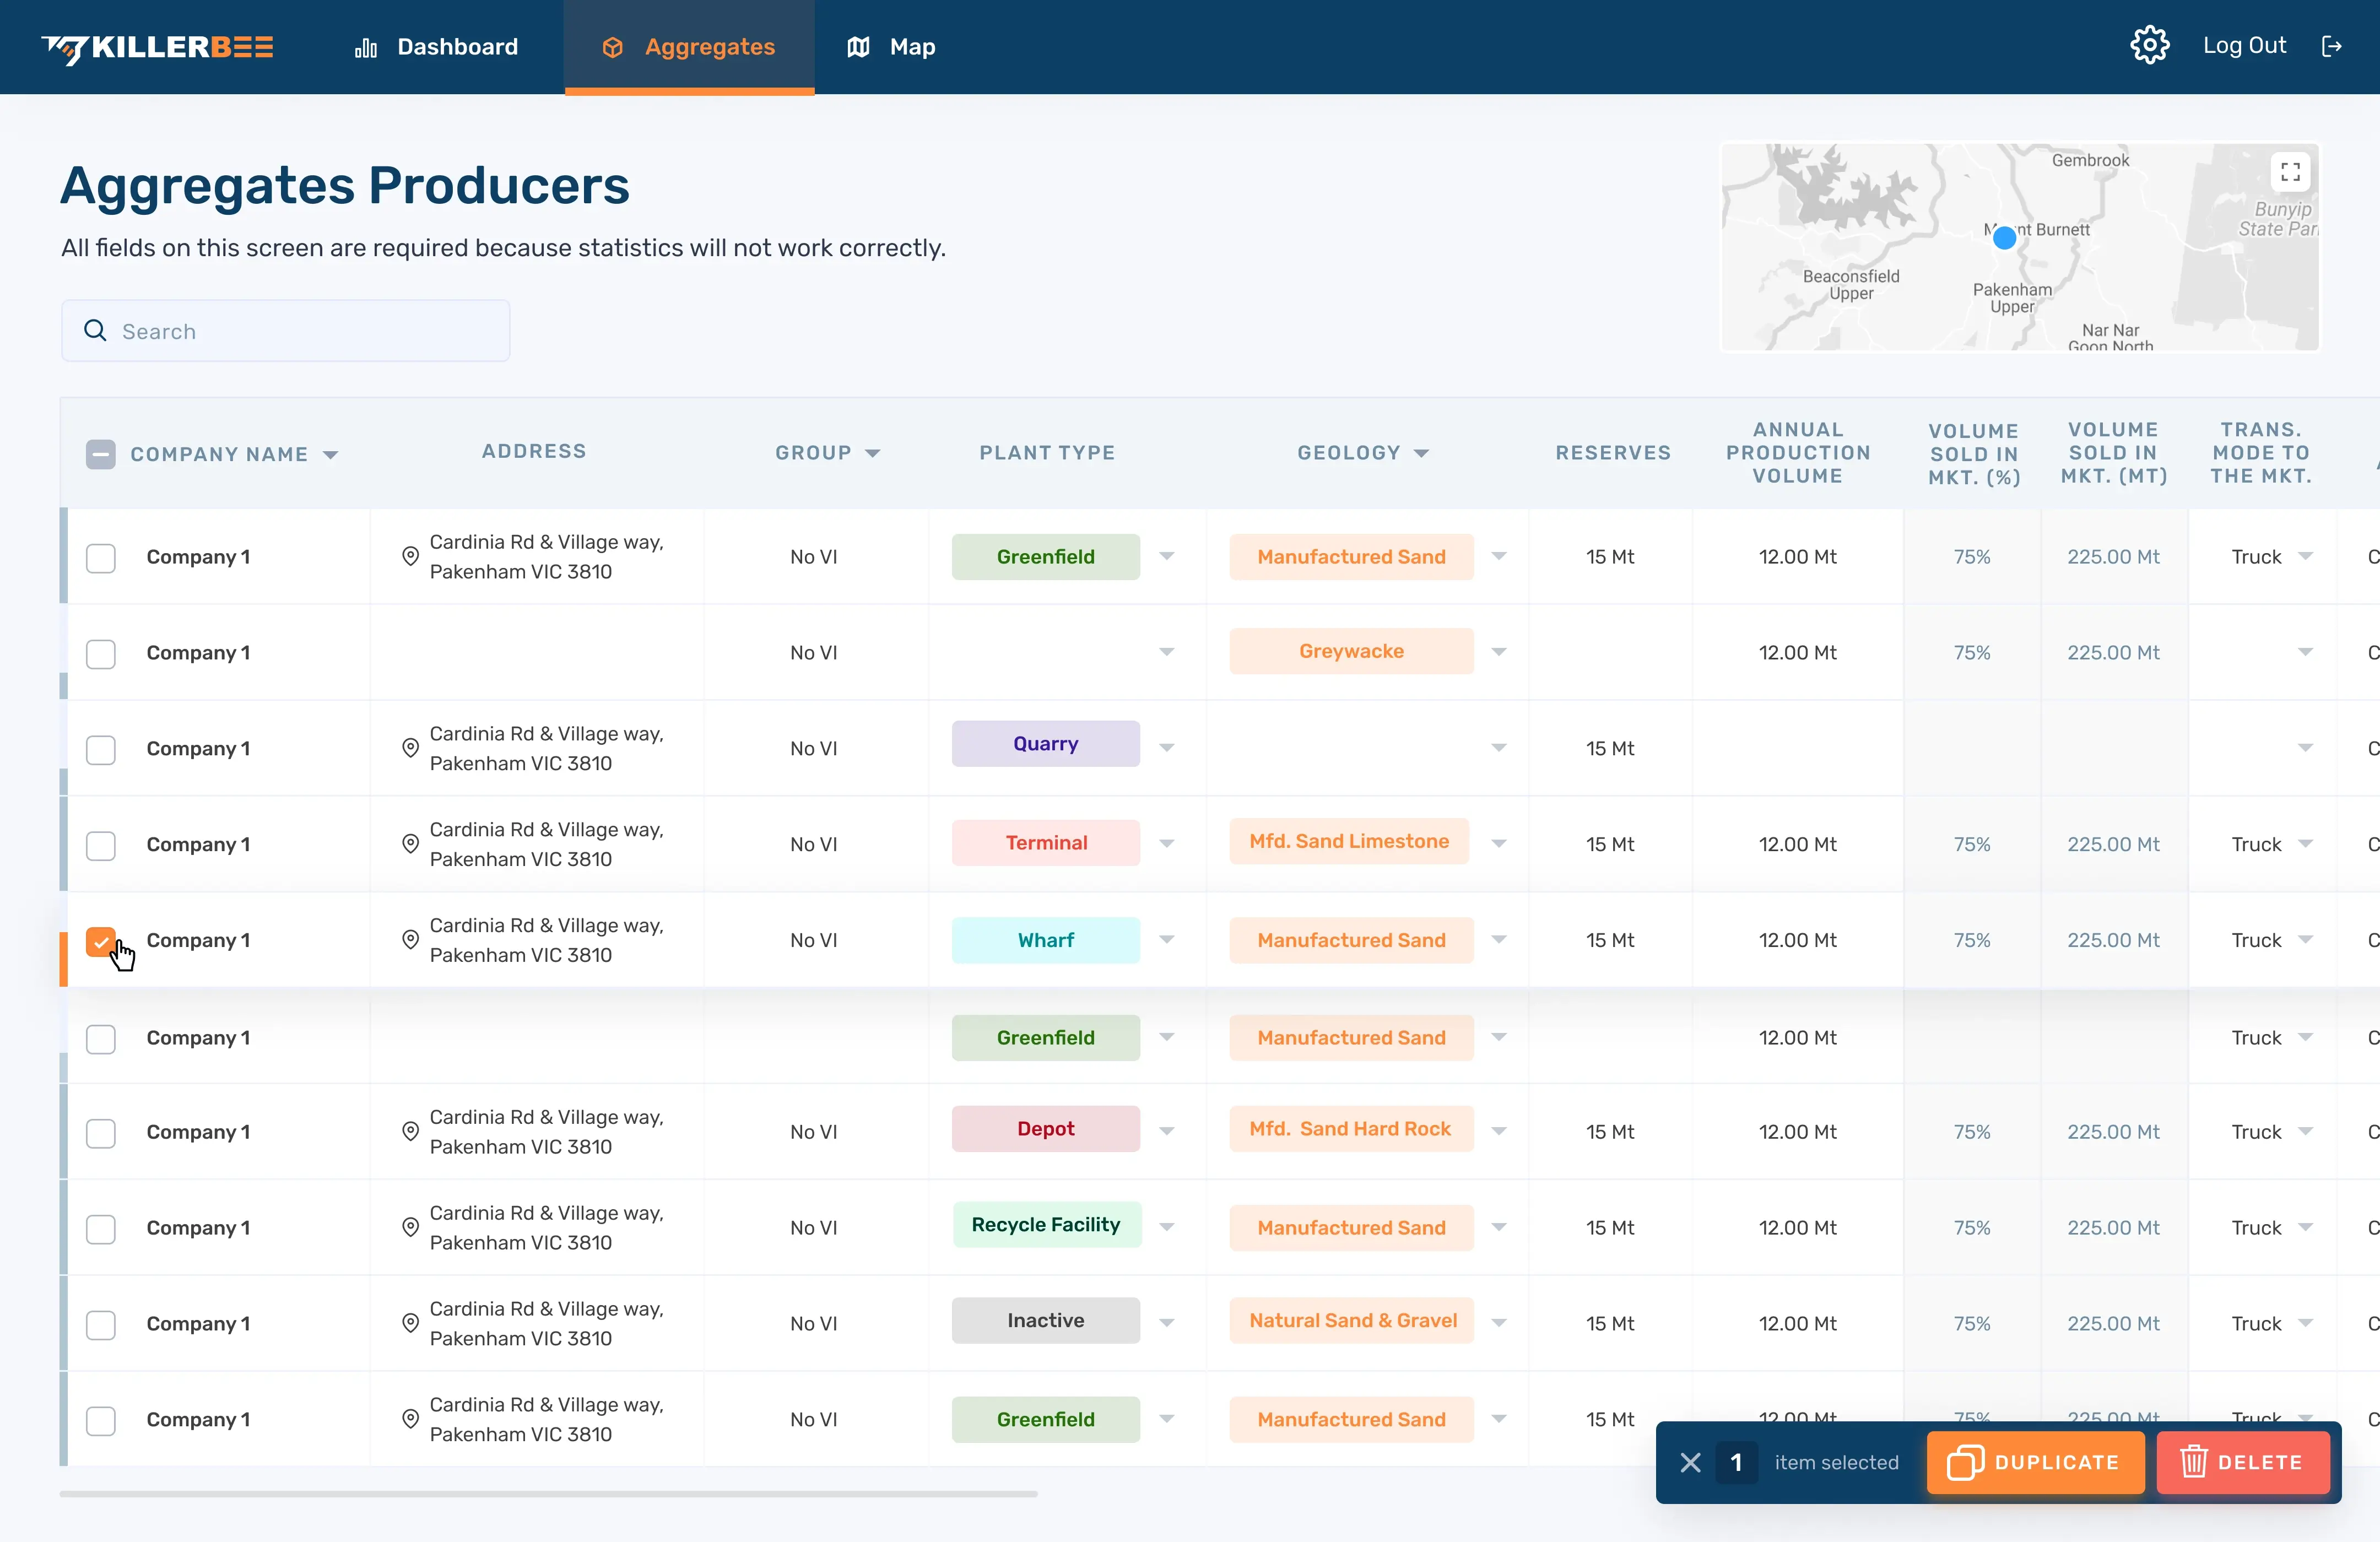
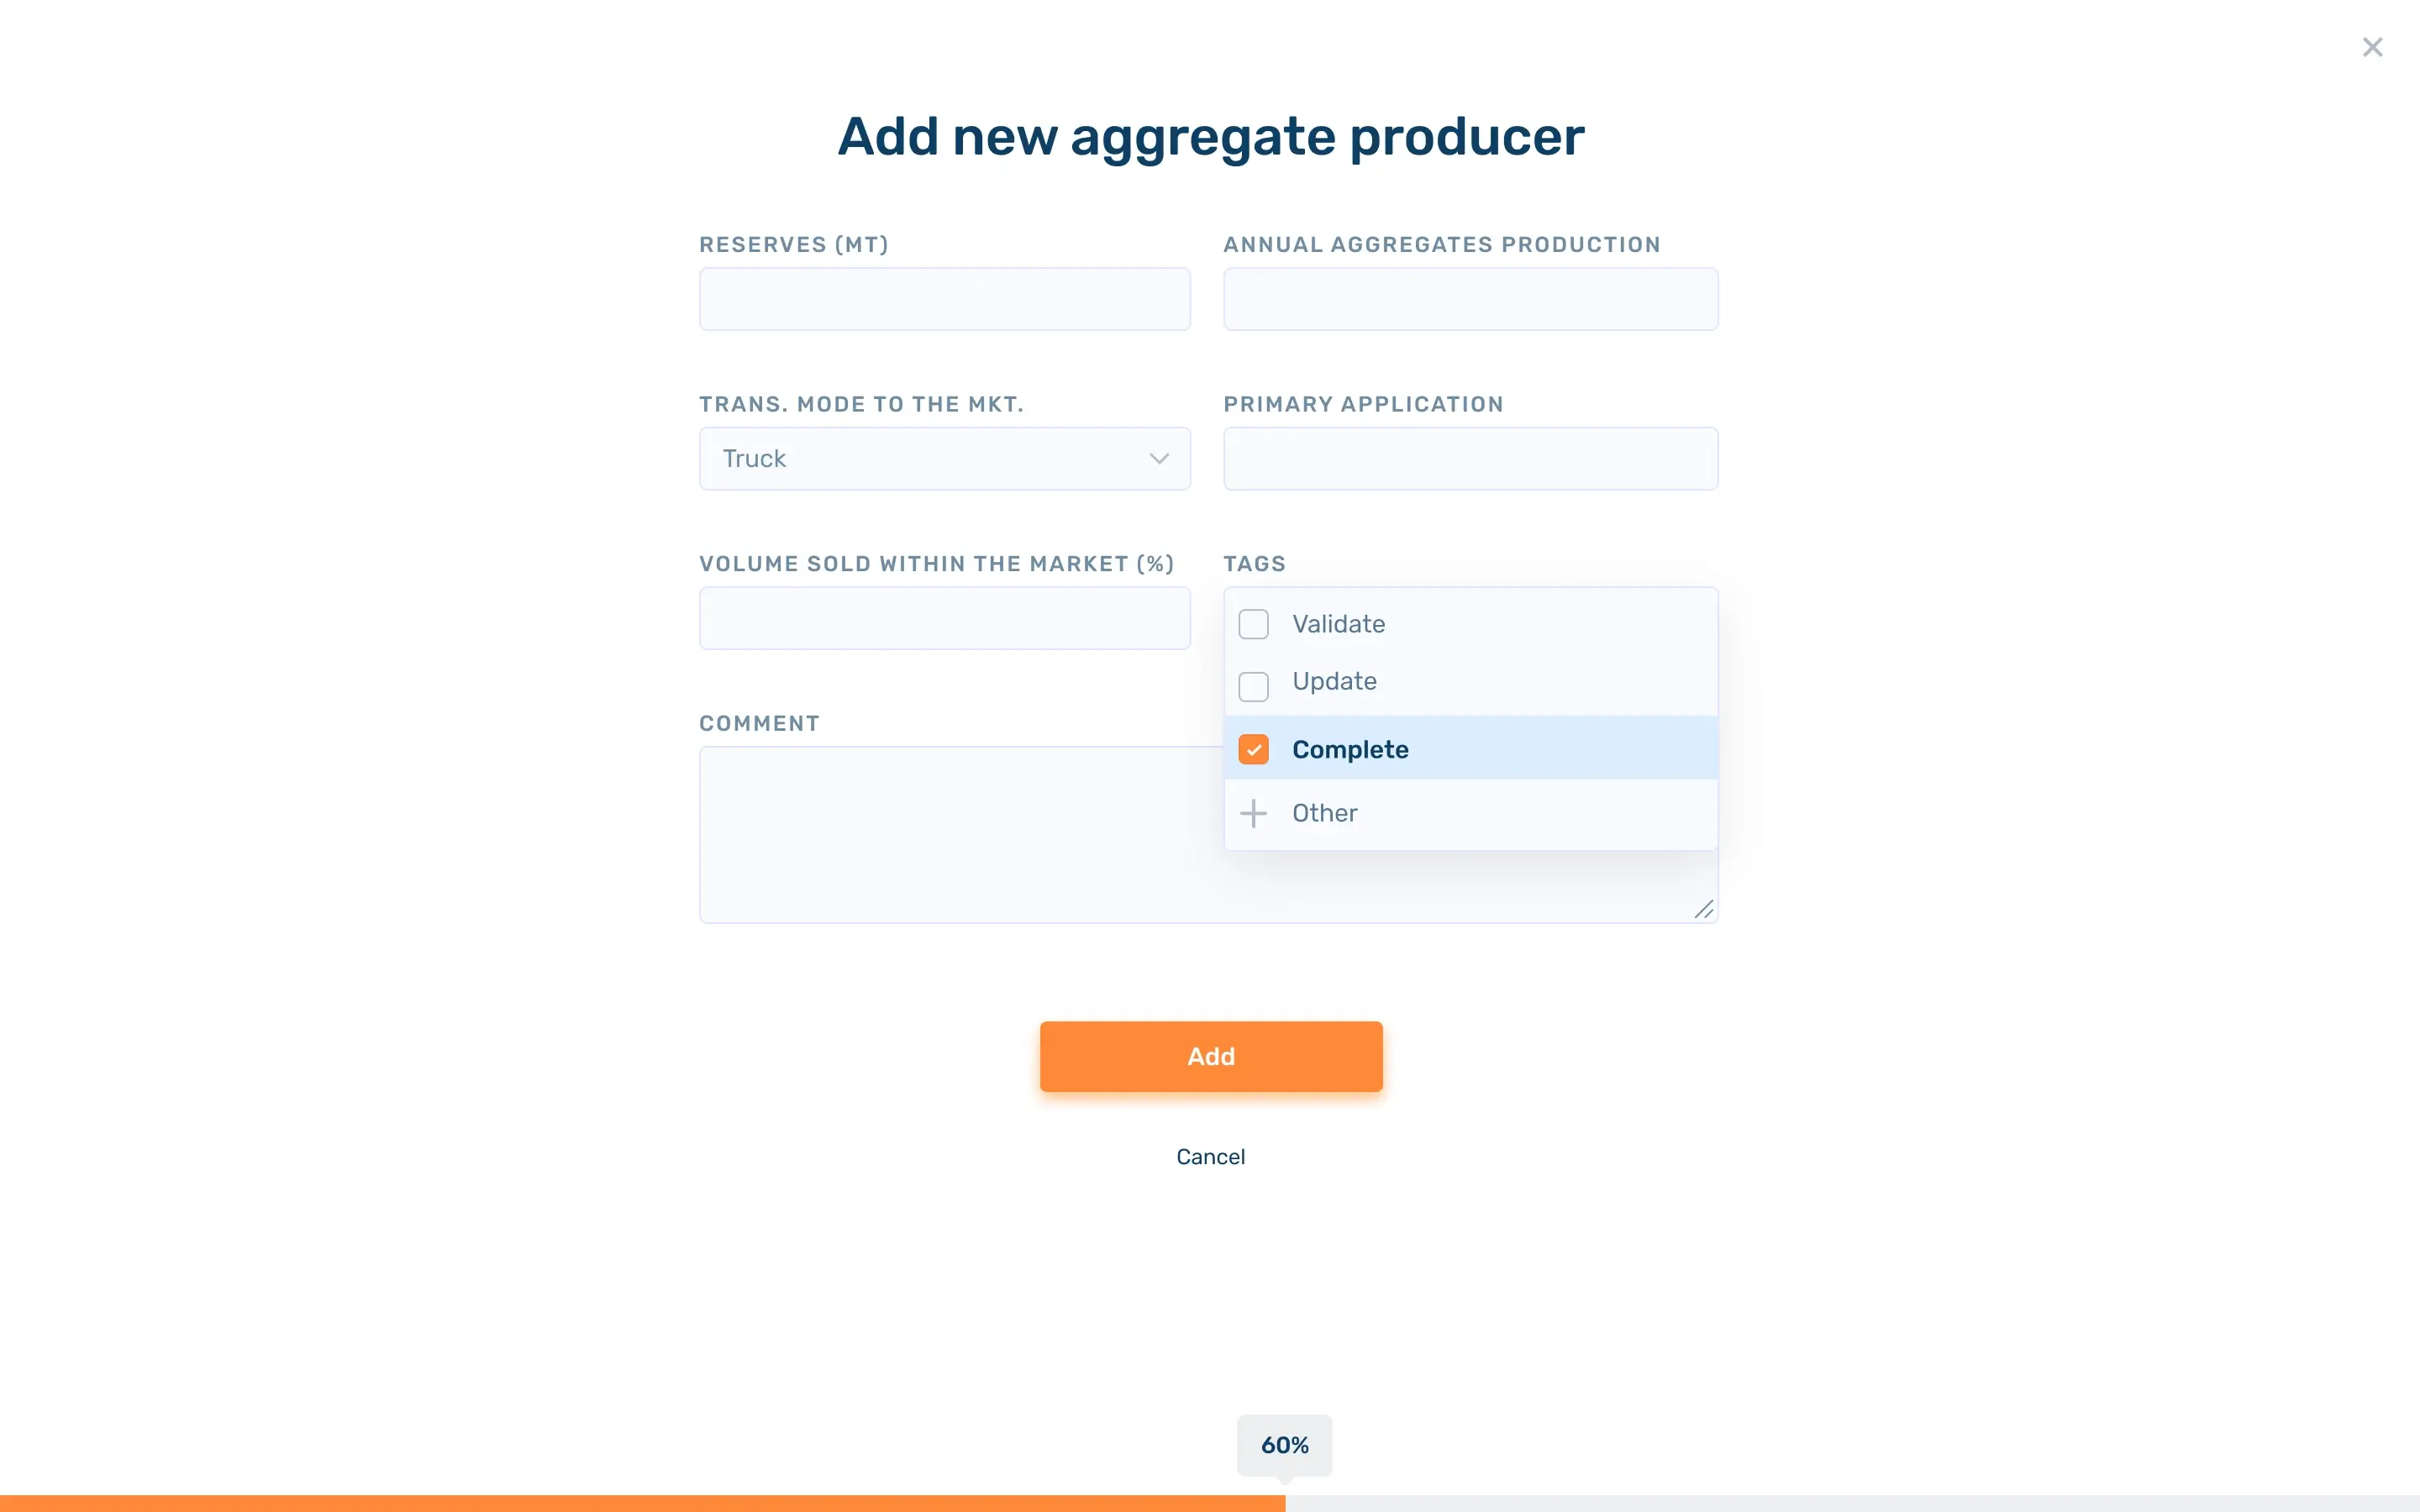
- Aggregates Producers. This part of the database is filled with details about each aggregates producer, such as a plant name, address, geology, reserves, annual production, volume sold, and transportation mode. Then, all this data is grouped into a table.
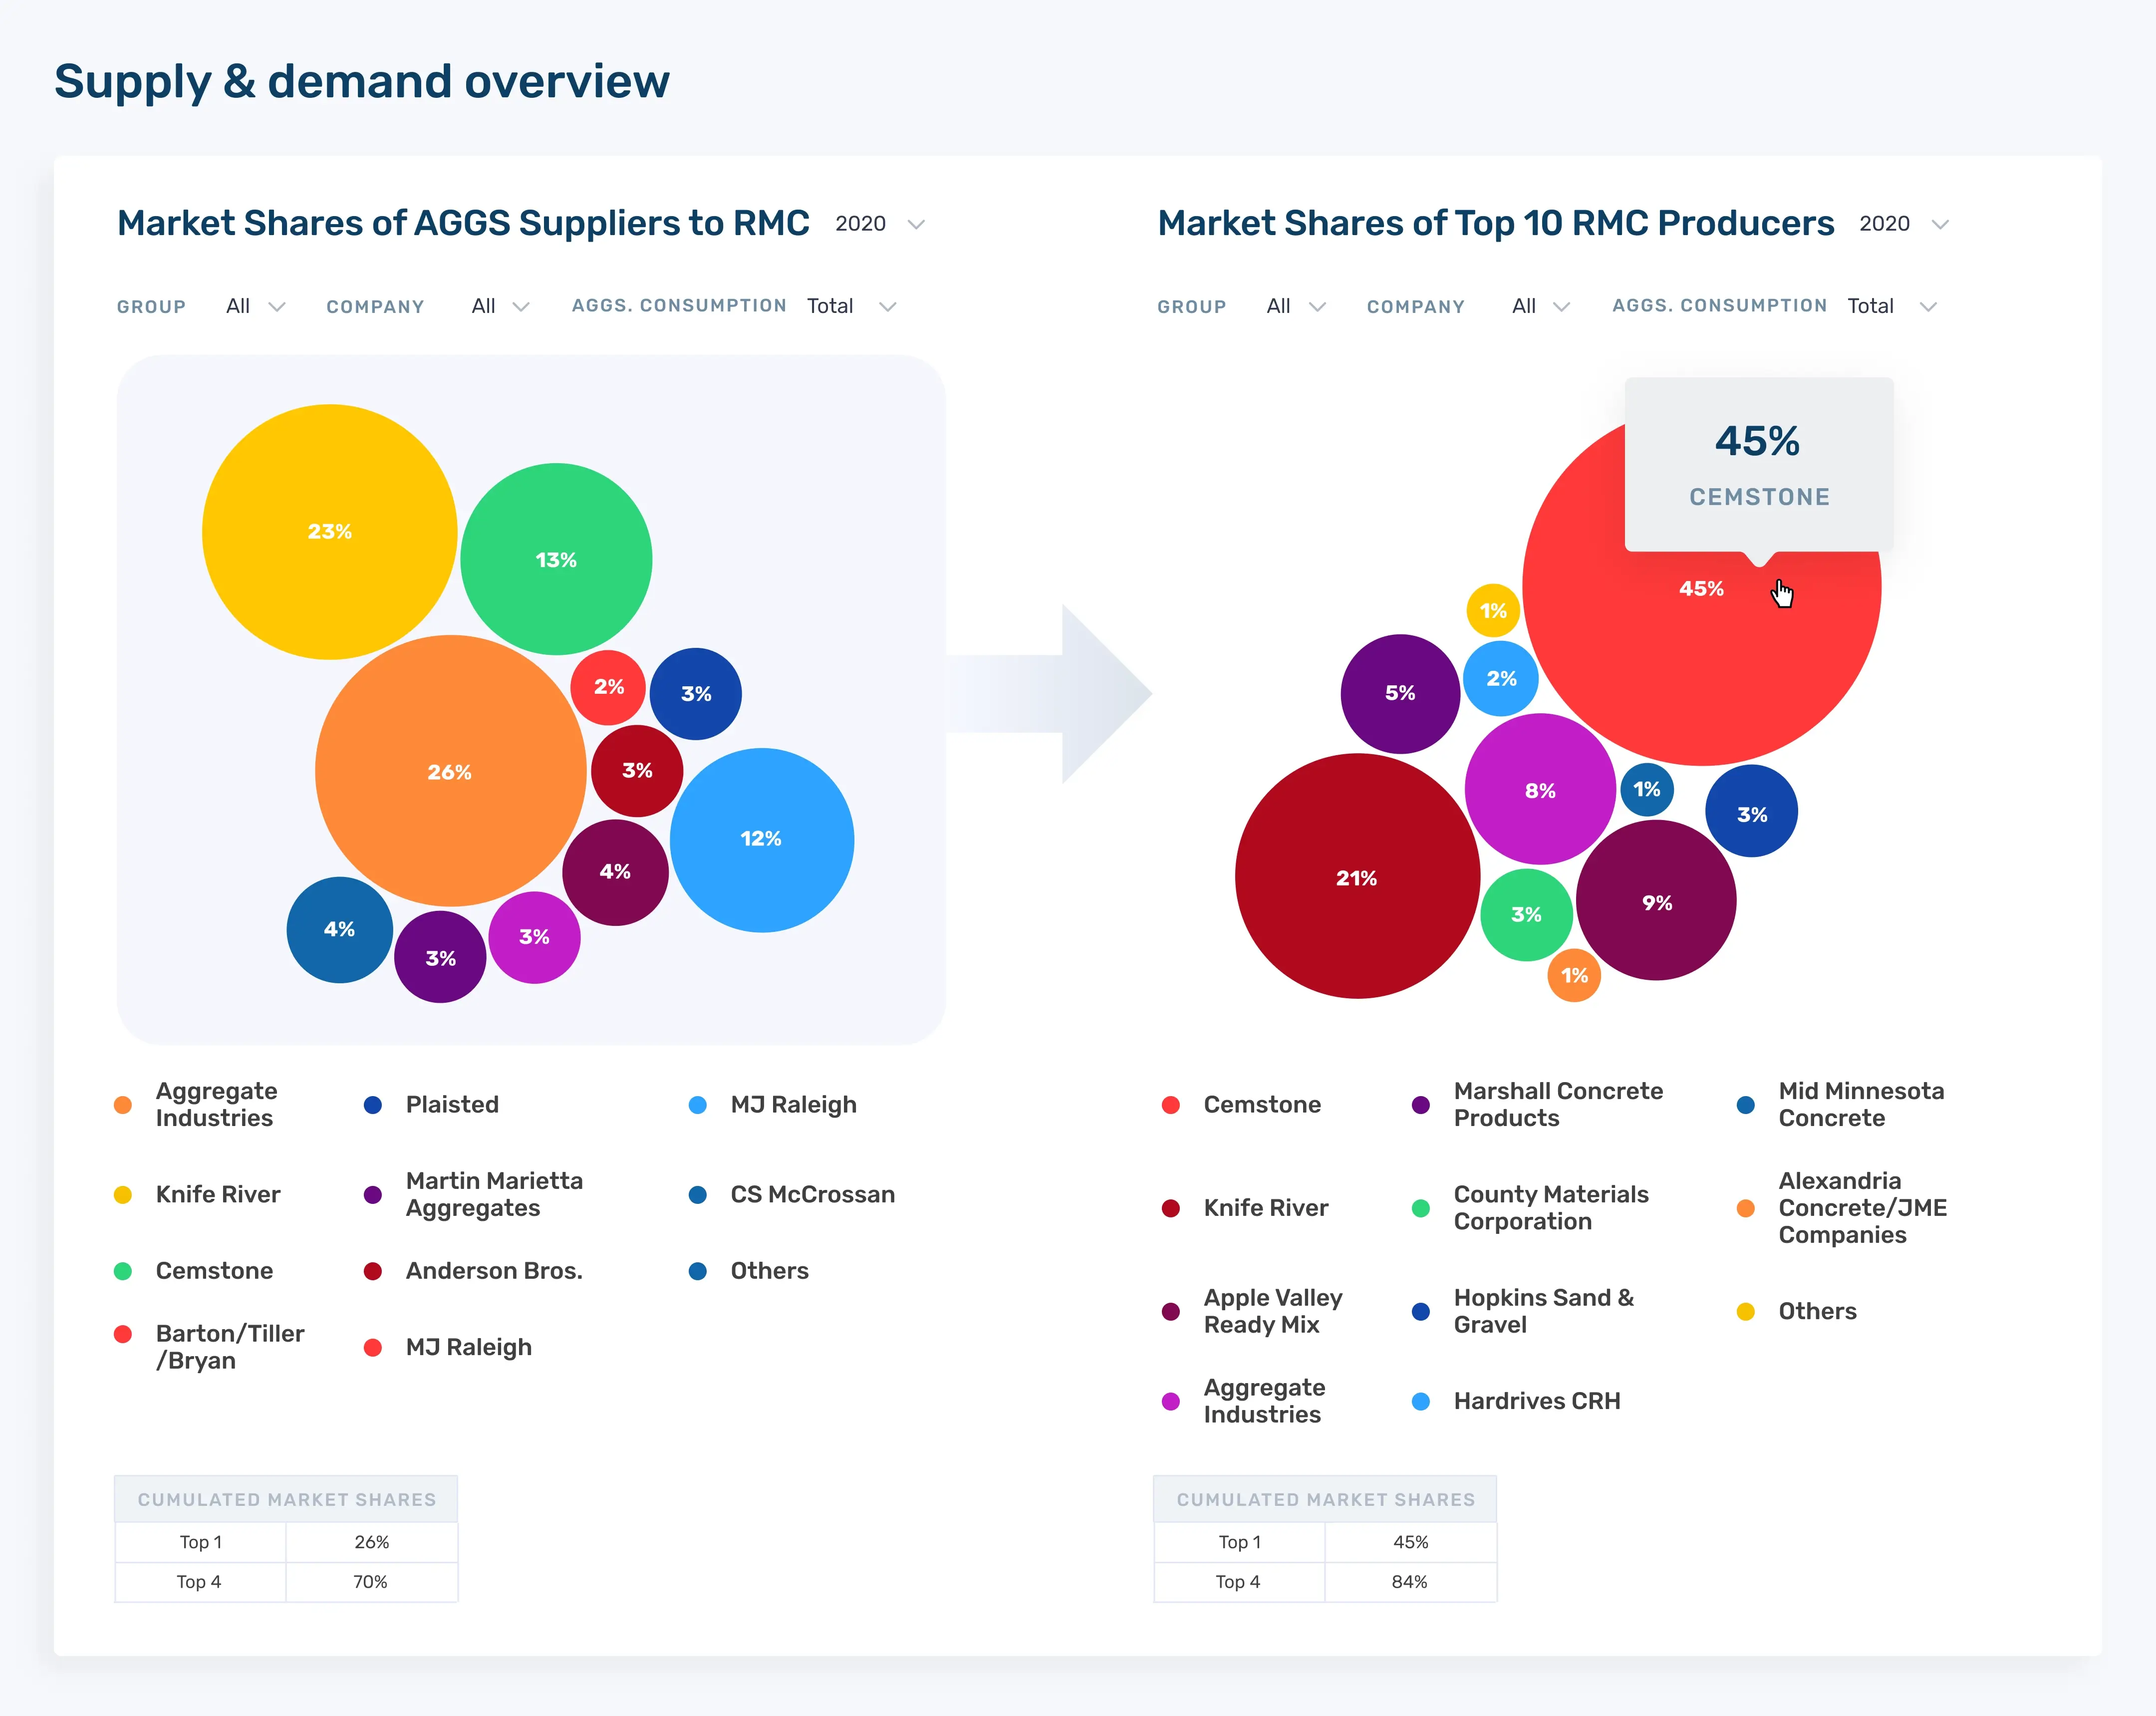
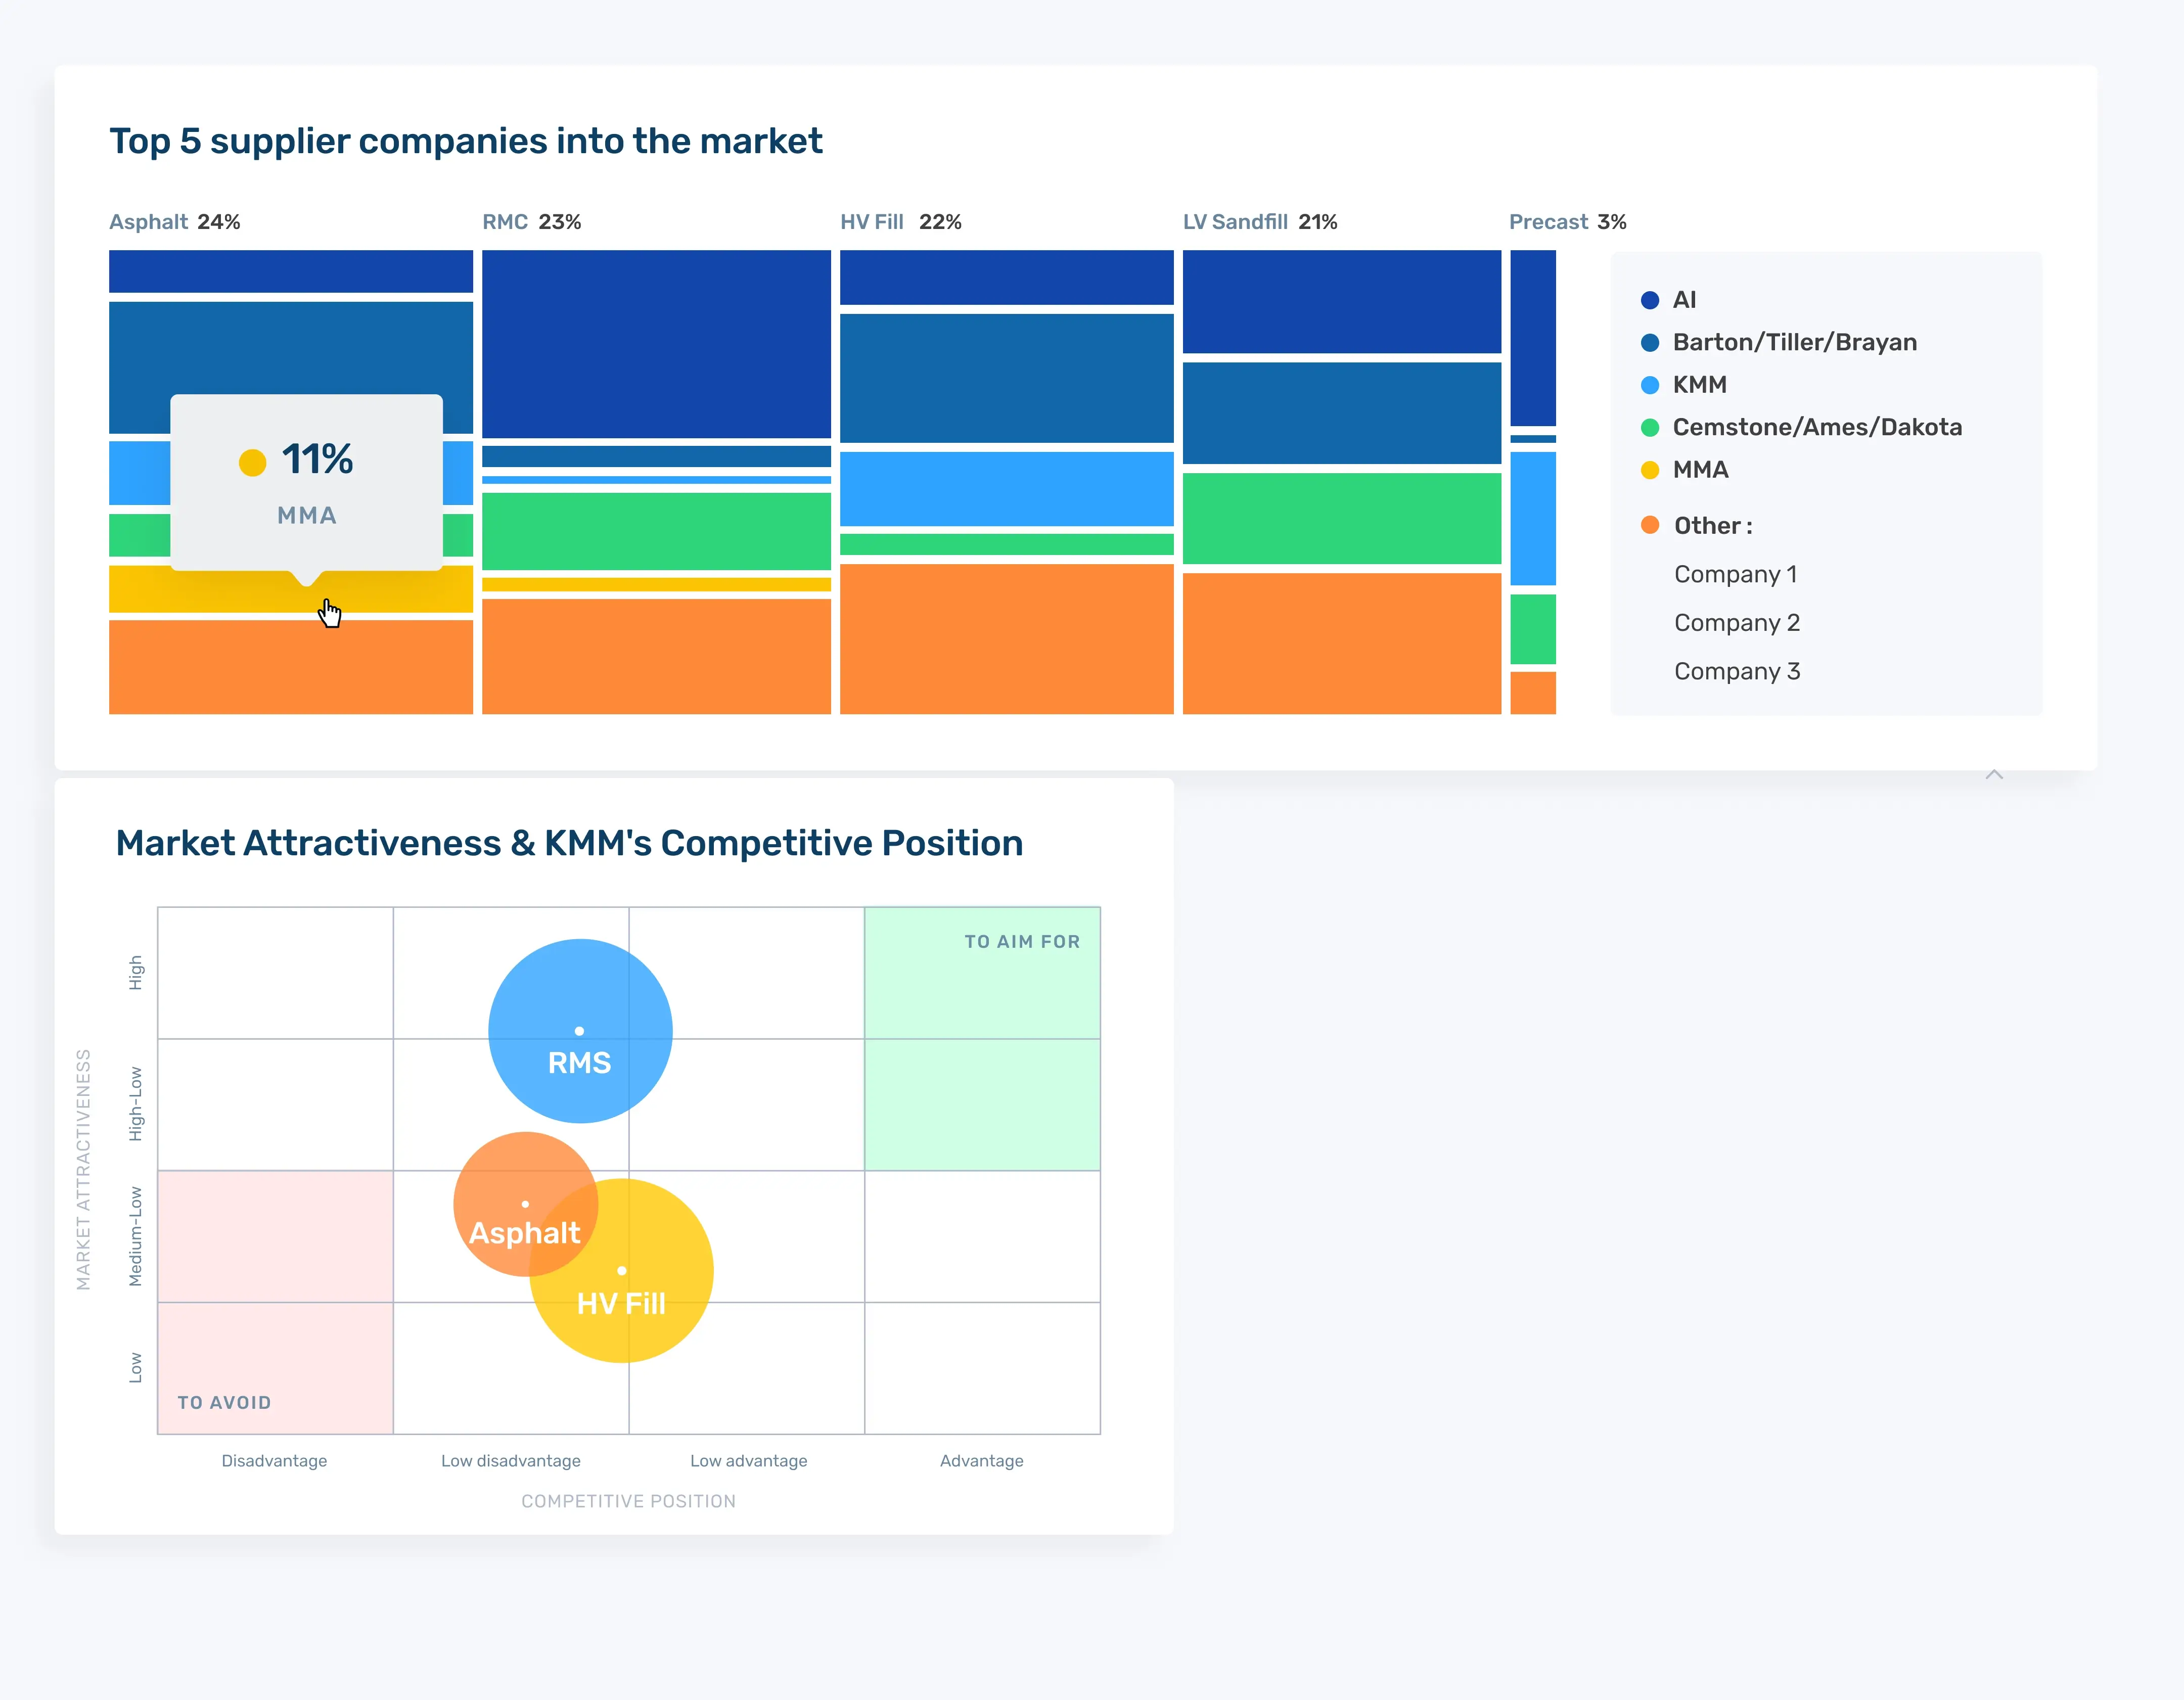
- Market Segments. The user can create an overview of different market segments, such as ready-mix concrete, asphalt, or railway ballast. Once all the needed data is entered, the system will create a graph illustrating the market shares of aggregates suppliers to each segment.
- Competitive Position. The user can self-evaluate the company’s competitive position against other suppliers within each segment. For example, they rate things like product quality, product availability, price at quarry gate and price delivered, on-time delivery, and customer service, and they can also add custom variables. The system then calculates an overall position within the segment, a position for each variable vs each competitor.
- Market Attractiveness. The system creates a market attractiveness matrix based on default variables like market size and growth, market profitability, reserve depletion, threats, free market, and so on. It’s possible to add and replace certain variables, too.
The whole data completion process is quite lengthy, so we implemented the autosave feature. Also, to ensure the accuracy of key figures and help make necessary corrections, we created a data consolidation and validation page with an overview of the complete database.
Result
By partnering with Redwerk, MarketBee achieved its goal of digitizing market assessment. They believe any aggregates producer should be able to create top-quality analysis without paying top dollar. By combining our expertise in building robust enterprise solutions and their decades-long industry knowledge, our client released a tool that enables comprehensive evaluation of aggregates supply and demand.
No more time-consuming spreadsheets and missed opportunities! MarketBee significantly improves market assessment accuracy, allowing users to make data-driven decisions that help increase revenue.
Need help with building data analytics software?
Contact UsTechnologies
Redwerk Team Comments

Olga
UI/UX Designer
This project was exciting, but it also presented a unique challenge. Since there weren’t any existing solutions quite like it, I had to dig deep. To create an intuitive interface, I started by understanding the specifics of the aggregates business. Then, I had to break down existing patterns into their building blocks to see which UI elements and UX solutions from everyday apps could be adapted for MarketBee.

Dmytro
Developer & Team Lead
It’s not every day you get to build a web app from scratch, especially one that crunches numbers like this one. Integrating Power BI with the .NET backend posed some challenges regarding complex data manipulation, but we overcame those limitations and achieved seamless data flow and synchronization. In the end, it was great to see everything come together and create a tool that helps people in the aggregate industry.
Related in Blog
Front-End Style Guides: Components, Specifications, Definition
Have you ever built a website that looked amazing in your head but somehow ended up looking like Frankenstein’s monster when you put it all together? Yeah, we’ve all been there. And it happens to mature businesses, too. Over time, your website or app evolves, but with each update...
Read More
Vue.js Review: Pros & Cons, Comparison
If you are a Front-end developer, sooner or later, you will be thinking about starting to learn a particular JS framework. At that moment, we would say, the fear of making the wrong choice kicks in. You don’t want to find yourself learning outdated technologies or tools that are ...
Read MoreImpressed?
Hire usOther Case Studies
KillerBee
Transformed decades of construction materials expertise into the #1 automated smart-pricing solution used worldwide
Recruit Media
Developed a patent-pending recruitment SaaS from the ground-up, which was later acquired by HireQuest


