What Is Code Analysis?
Probably everyone who is involved in software development understands how important code quality is. It affects how easy it is to maintain the code, understand it add new features, and of course, code quality has a significant impact on software quality. Since almost every developer has his own opinion on what code quality means, the question “What is software quality?” can cause heat debates. Despite this, there are some generally accepted standards that most developers try to stick to, such as how clear, simple and elegant is your code (so someone who is not the author can maintain and understand it), how easy the code can be extended, its performance and so forth. One of the ways to achieve good quality is to use code analyzers. So, what are all these analyzers about?
Actually, the name speaks for itself; such tools are used to inspect the code and report information about its quality, e.g., whether the violations in the programming and design rules were found, data about code complexity, etc. Source code analysis can be both static and dynamic. The static one is performed without actually executing the code. This kind of software scans all the code in a project to find out vulnerabilities, validates it against industry best practices and also provides the ability to validate it against the company’s coding rules, etc. Such analysis can also be performed as part of a code review. After the static analysis can be used dynamic one to uncover more subtle defects. It uses the opposite approach and means analyzing based on the execution. The most common approach is executing Unit Tests.
Combining these types of analysis should help to find near 95% of the faults, provided that the analysis is performed by a person, who understands the source code. However, both of them have their own weak sides. For example, code analyzers have no understanding of code author intent and may report false positives (a possible vulnerability that in fact does not exist), or false negatives (vice versa, when a vulnerability exists but the tool does not report about it). It cannot either guarantee the full test coverage of the source code and cannot check the correctness of a code operation (i.g. it cannot verify that your code works as your customer expects).
As a .NET development company, we have a great deal of experience with different tools that improve the code. In this article, we will focus on static code analyzers, and also consider NDepend, a static analysis tool for .NET managed code.
Choosing a Static Analyzer
So, let us imagine you decide to use a static analysis tool. The choice of suitable tool is always an individual process. Some developers use static analyzers plugged into their IDE, some prefer third-party solutions. Here are a few common things to consider when deciding which tool is right for you:
- First of all, find only those tools, which support the programming language and IDE you choose.
- Do not hesitate to look through reviews for these tools and try them out a little – in this way you can ensure that the chosen solution is as good, as you need.
- Check tool ability to easily define additional rules so the tool can enforce internal coding policies.
- Look through the pricing model of each tool.
- Think about what you need from the tool and remove from consideration those that do not provide such functionality. For example, some of the tools focus only on code quality, so, if your goal is to check security as well, then obviously they are not your choice.
- How actively the tool is updated. New issues occur constantly and you need to be sure that the authors of the selected tool update it regularly.
Keep in mind that using only static analyzers is not a way out. First of all, strong processes can ensure application security and code quality from the very beginning. Except this, you also need someone who can review the results of analyzing and decide what should be done when problems are found.
Redwerk provides full-cycle development from initial concept to a live solution and we are very attentive to the quality of the code. That is why, when we received a request from Patrick Smacchia, the lead developer of NDepend, to try out their tool, we agreed with this proposition and as a result, we decided also to provide some overview of this tool. At the moment of writing the article, the version of NDepend was 1.9.
.NET Managed Code Analyzer – NDepend
NDepend tool supports a large number of code metrics, including dependency graphs and dependency matrix to explore the code structure. We will review the standalone UI NDepend Professional program. Except this, NDepend provides a number of integration variants:
- Visual Studio extension.
- A console executable, which is used to run an analysis with NDepend and build a report. It takes command line arguments and the only mandatory parameter is an absolute path to the NDepend project file that defines the code base to be analyzed.
- PowerTools is a set of small programs based on NDepend.API. They are open source and are used for demonstrating NDepend API syntax and capabilities.
- Azure DevOps and TFS Extension.
- NDepend TeamCity Plugin.
- There is no such integration with Jenkins, Atlassian Bamboo, and AppVeyor like, for example, exist for Azure, but it is possible to integrate with them through the NDepend.Console.exe.
- SonarQube integration.
- CruiseControl.NET integration.
- FinalBuilder integration.
- AddIn for Reflector.
- You can also import OpenCover, JetBrains DotCover, or NCover (3.X and above) coverage results files to NDepend project.
As you can see NDepend provides wide variants of its use. They also provide a free trial with a batch of the professional edition functionality. In this article, we will try to provide a step-by-step guide of working with NDepend and, hope, this will help readers to decide whether it is presently suitable for their current projects or not. As a piece of advice, if you think that such a tool is not needed at the moment, you can review NDepend anyway, because when you need some static analyzer, you will reduce the search time for a helpful tool.
Installation Process and First Launch
NDepend is distributed as a .zip file. This is a controversial question, which is better: to provide an MSI installer or .zip file. Both of the variants have pros and cons and will have their supporters. Anyway, because of the current variant of distribution, the installation process of NDepend is pretty simple, you just need to unzip the files in an application folder on your machine. The only remark is that it is not recommended to unzip files in ‘%ProgramFiles%\NDepend’ folder. This can cause problems due to Windows protection. On the first launch, you need to enter your license key and after that, you see the main screen, where you can install the needed extension (for Visual Studio, Azure DevOps, etc) and create a project for analyzing. The below screenshot illustrates the main screen of the tool.
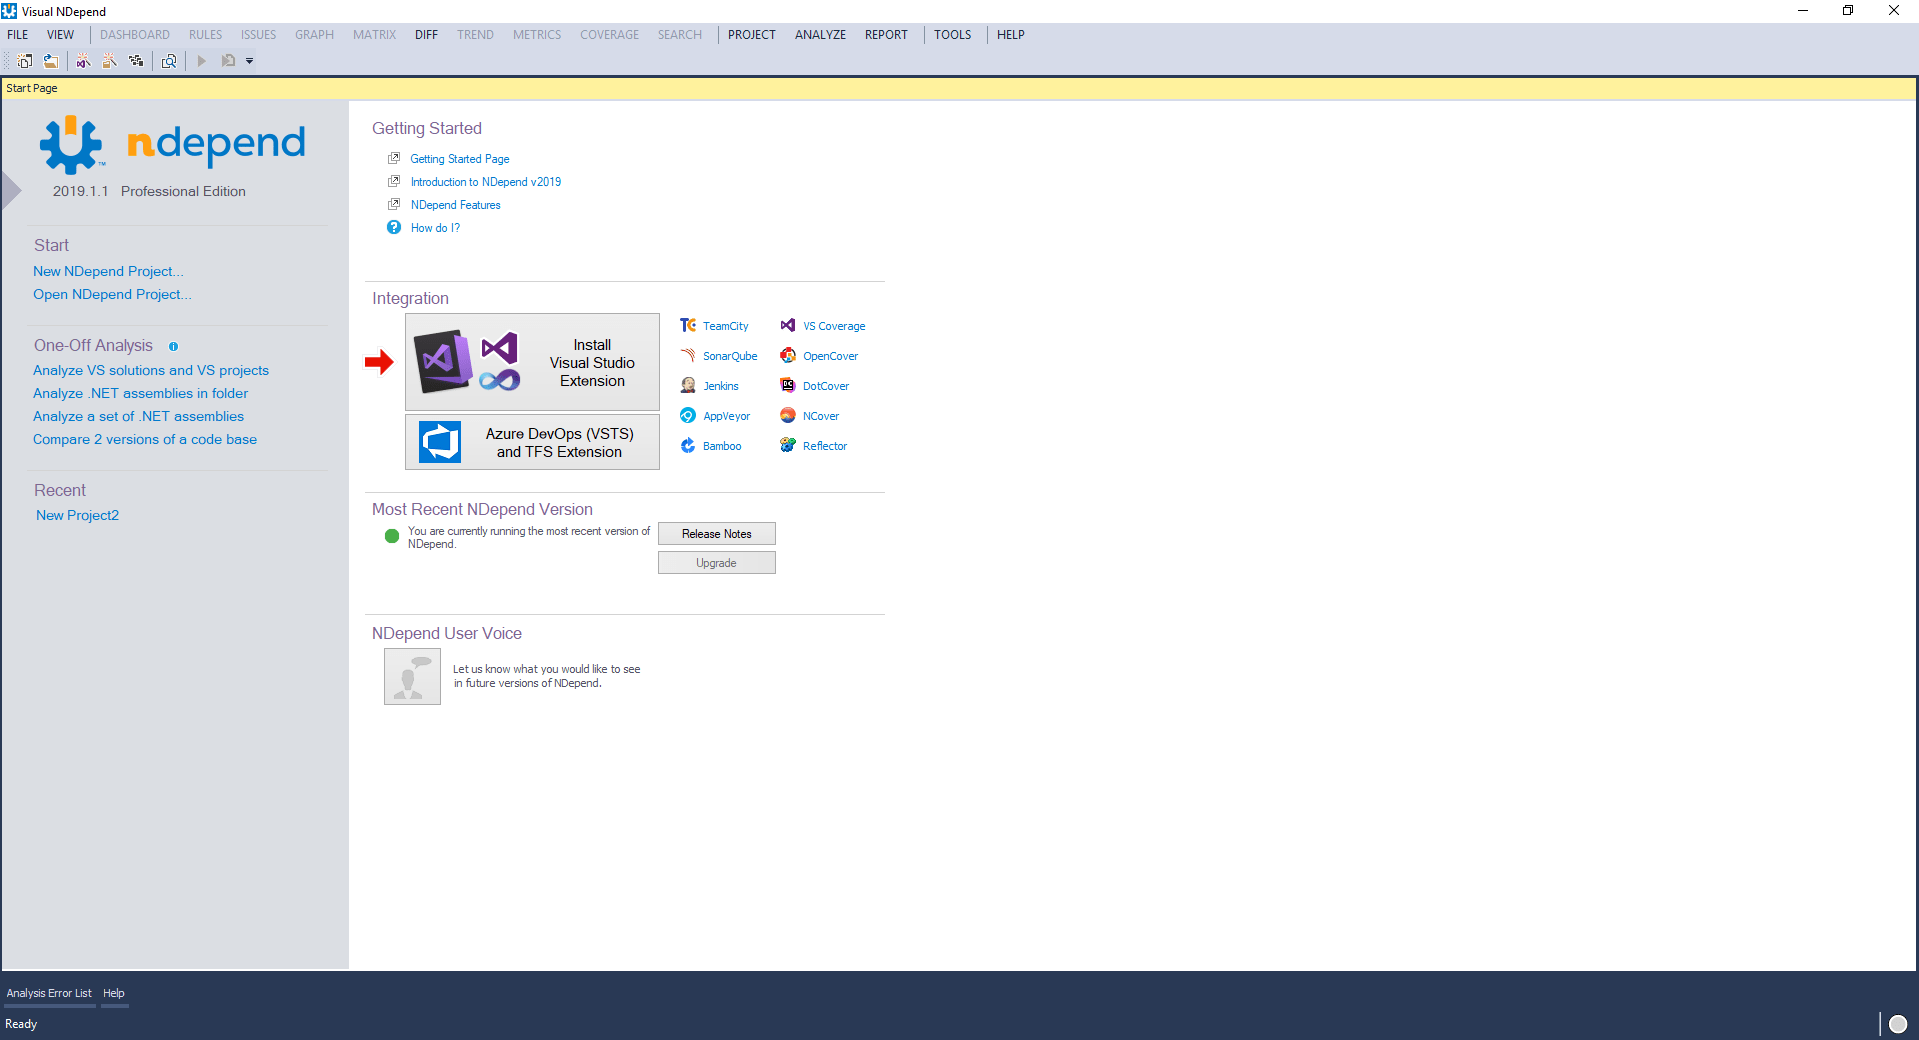
The interface is pretty simple and reminds interface of Visual Studio. And this is not a coincidence, because NDepend skins contain a number of Visual Studio, MS Office, and DevExpress skins, including even the option to change the menu text from upper- to lowercase.
Since we review the standalone program, we need to create a new NDepend project. For the purposes of this article, we will employ our test project, used to show examples for one of the previous articles. The process of creating is pretty standard and simple: you just need to provide a project name, its location and file name. After this, you see a Project Properties panel, through which you can choose the assemblies and set the required analysis’ options.
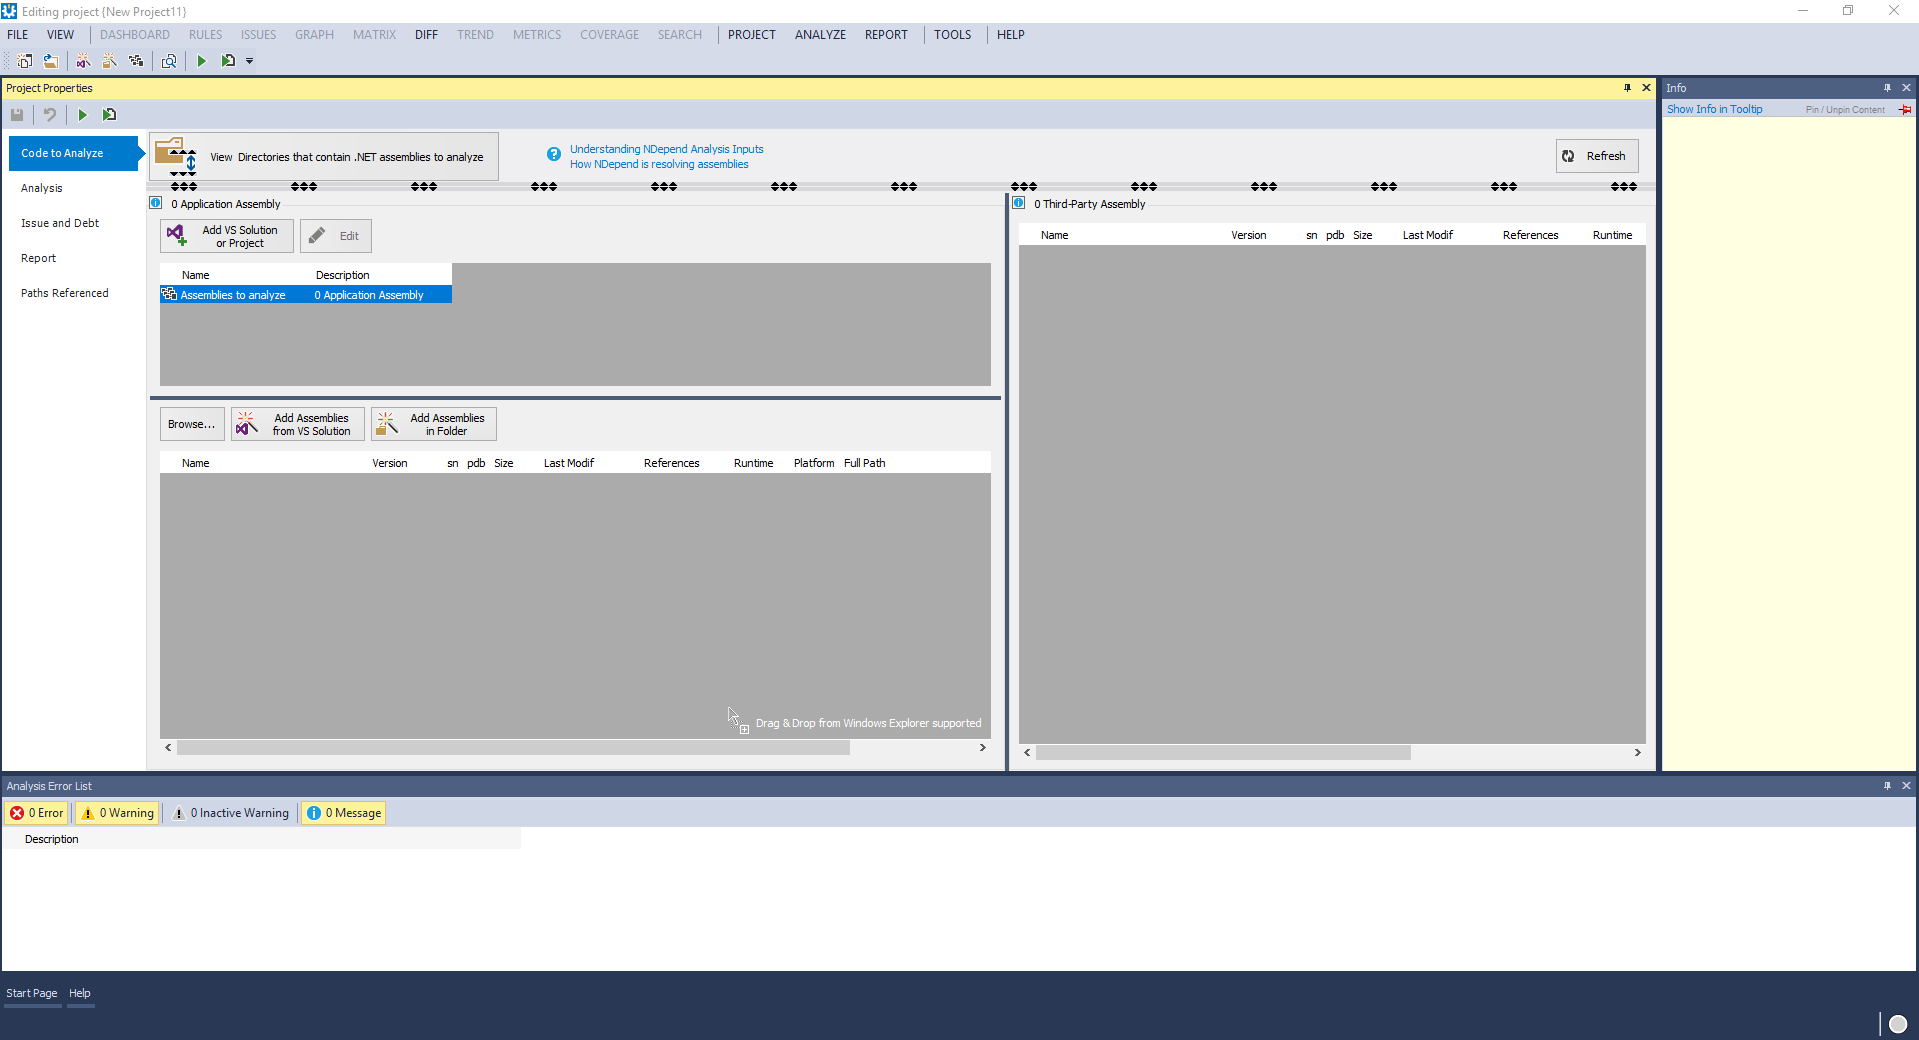
Let us review these analysis options one by one to make a general impression on which options you can set up:
- The tab “Code to Analyze” allows you to choose the assemblies to analyze, which includes both your own assemblies and third-party ones that are used by your application (like mscorlib.dll or Log4Net.dll).
- On the “Analysis” tab, you can change the project name and output folder, if needed, and also, it allows configuring some analysis options. You can define, for example, the next options:
- with which of the previous analysis results the current performed analysis need to be compared;
- define the location where historic analysis results are stored and the frequency of savings;
- define the frequency of trend metrics log, and the location where they are saved. These values are logged at analysis time;
- set coverage files (the NCover, dotCover, OpenCover or VisualStudio XML) from which the test coverage statistics will be gathered;
- set Source File Rebasing option, which is used when the code compilation and the NDepend analysis are executed on a different machine. If it is specified, information will be gathered not only from the selected assemblies but also from the source files if they are available.
- On the “Issue and Debt” tab you can set up technical-debt computation and results. The technical-debt is the estimated man-time that might be required to fix the issue. More details about this option and provided settings you can find in the related NDepend documentation.
- The “Report” tab actually allows customizing provided reports (e.g., activate or deactivate such options like avoiding too big reports for the large code base, hide third-party assemblies and so on).
- The “Paths Referenced” tab shows all paths referenced by the NDepend project and here you can manage the redirection of paths. It also contains an explanation about types of path, that can be used and allows managing the path variables.
After we reviewed the kit of available settings, let us go to the review of NDepend features. Click on “Add VS Solution or Project”, select the project, which you want to analyze, and click on the button “Run analysis on Current Project” (or click F5). The analysis is pretty fast (we tried on several projects of different sizes) and after analyzing you will see a dashboard fulfilled with the results like it is shown below:
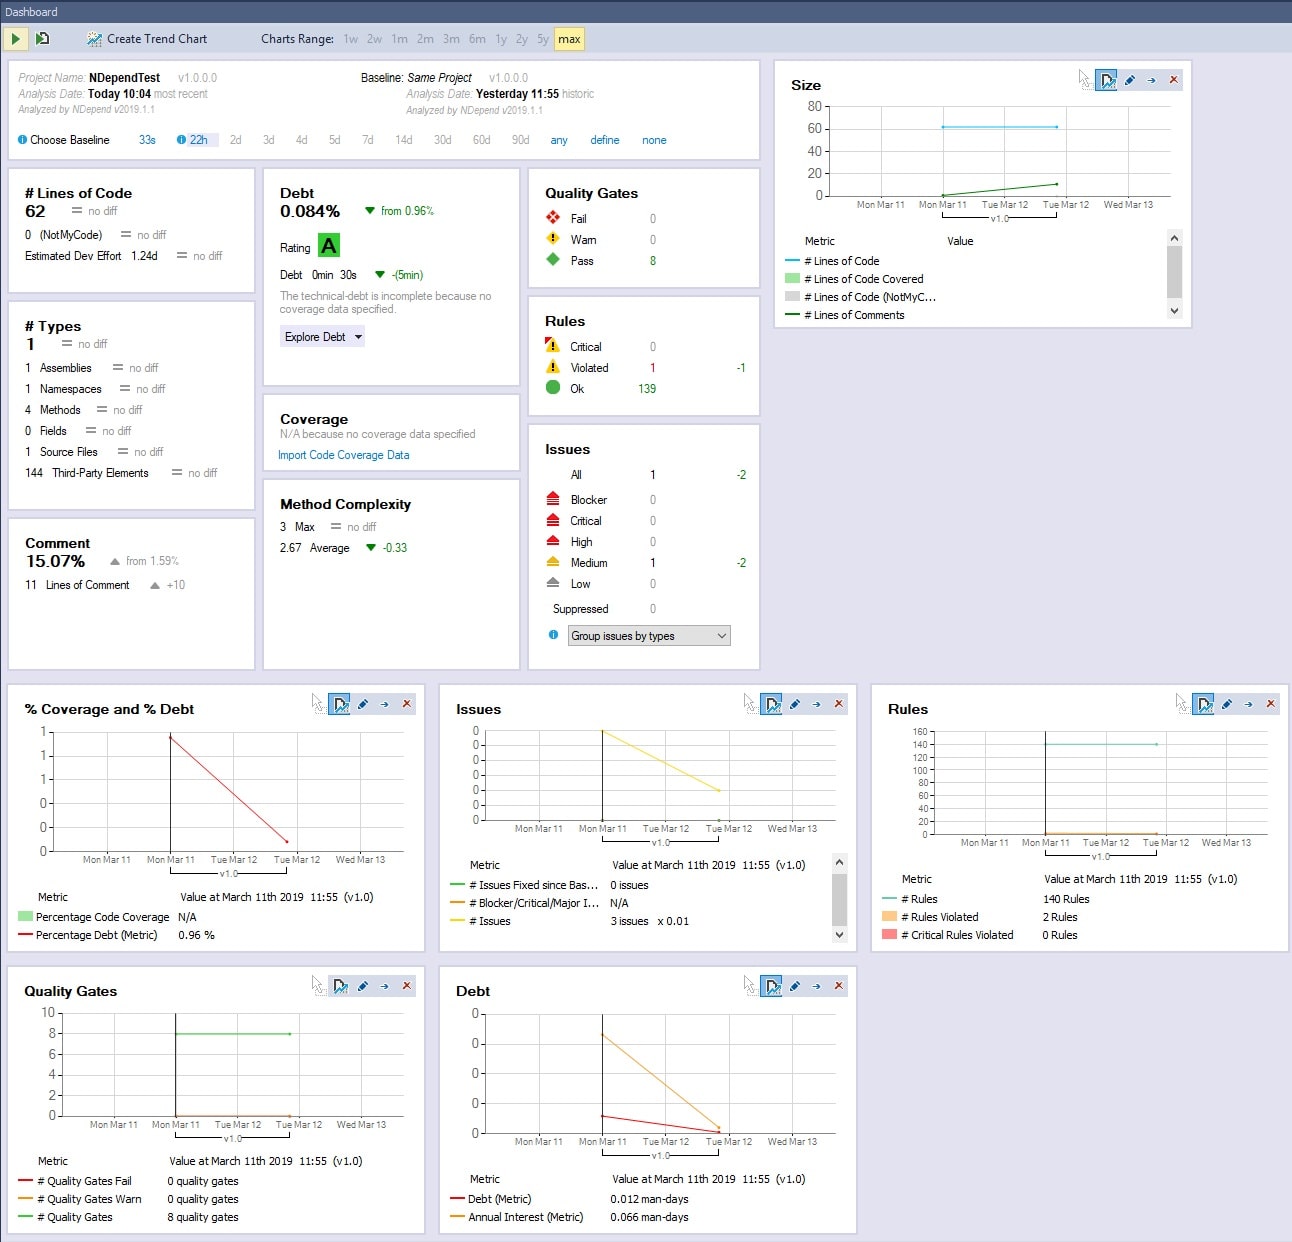
On the top, you can find structured information about the analysis results, such as the percentage of comments, the number of lines of code, the number of fails, warnings, etc. The trend charts, which are shown on the bottom of the screenshot, provide an overview of the changes in your code quality over time. At first run, it may seem not too informative, but later on, after the work on code improvements, you will see the progress.
You can click on the values in “Rules”, “Quality Gates”, and all other boxes to see more related information. For example, there is 1 Violated rule in our test project, and if click on the value, on the right side there will be shown a piece of short information about the problems. If you right mouse click, and select “Pin Description in Info View”, you will see a detailed explanation, as it is shown below:
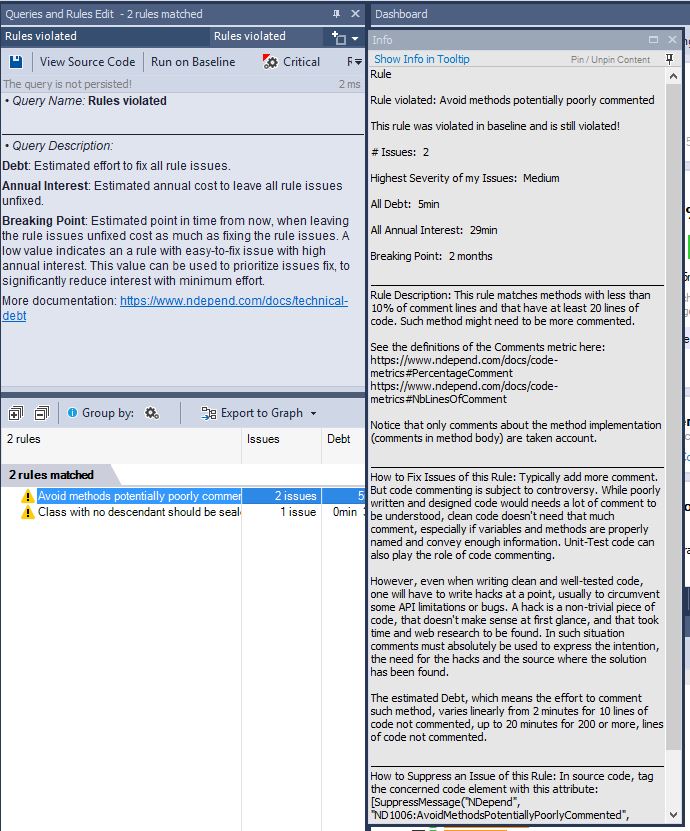
Such explanations are pretty informative and contain both the description of the problems and links to see more detailed information. By double-clicking on the rule, you will see where the problem is actually located. A counter on the right side of the boxes shows the number of fixed issues (you can find them on the screen capture above).
Code Language Query
Below the “Dashboard”, there is “Queries and Rules Explorer”, which is one of the important panes for understanding and customization of your analysis. It shows all the rules applied and you can easily activate or deactivate any of them or even write a new one, whichever is suitable for you. All rules are written on Code Language Query (CQL), which syntax is similar to LINQ, so there should be no problems with adding or editing rules, especially because of the editor has syntax highlighting, code completion, and tooltip documentation.
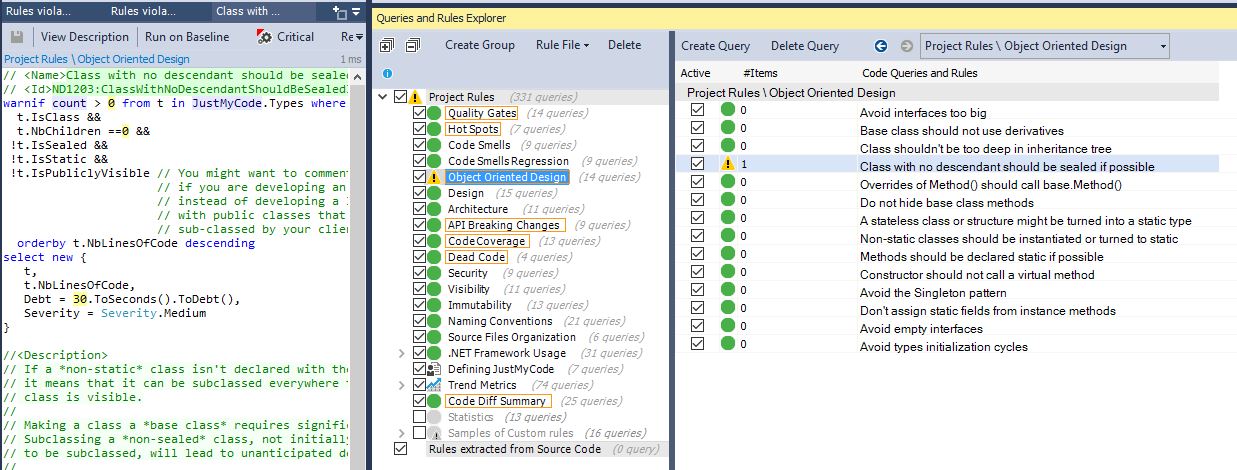
This is a really powerful and great feature from NDepend. Despite that, they provide a lot of default code metrics, many people would be excited about having an ability to add their own business or personal rules, which they find as a “must-have” for checking the quality. All changes are saved into the .ndproj file, so if you share it, for example, via source control, the whole team will have the new changes. At the very beginning, it can take a while to set up all the needed rules, but after this, you will be sure that analysis is 100% suitable for your project.
All predefined rules have comments that provide you with a more comprehensive description. To see such an explanation, you just need to click on the rule, which you are interested in, and on the left side, you will see it CQL query and a description.
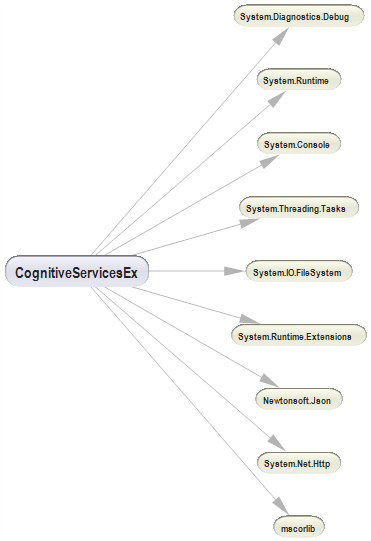
Dependency Graph
NDepend has one more great functionality – dependencies graph, which can be really helpful for big projects when you try to understand the structure and dependencies. The size of each node is directly relevant to the number of lines of code it contains, but this parameter can be easily switched on the pane. The graph is colored, which helps to visually separate assemblies it depends on (in blue) and assemblies contingent on it (in green). Each node is navigable, so you can open your source code just by clicking on the needed node.
Dependency Matrix
As you can see, for a small project the graph is fairly understandable and miniature. For big projects the situation is quite different – the graph is huge and pretty confusing and, indisputably, it is hard to show a complex big project structure as a small clear graph. For browsing large structures the dependency matrix suites better.
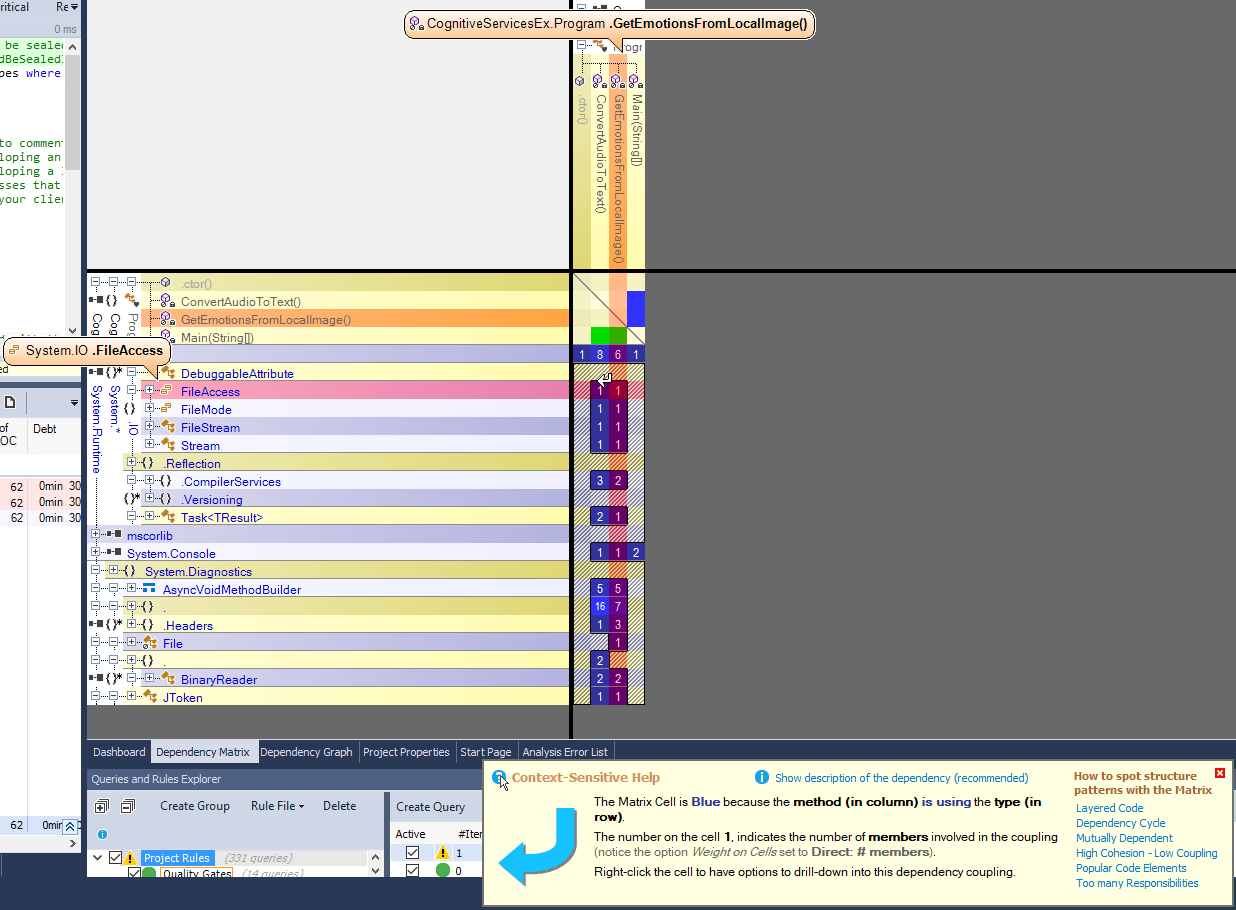
The matrix also shows dependencies between assemblies and their members and other assemblies in the project. Each non-empty cell contains a number, which shows the strength of the bonds (number of members, methods, fields, types or namespaces involved in the coupling). The color of these cells also has its meaning and can help you to identify the code that needs refactoring.
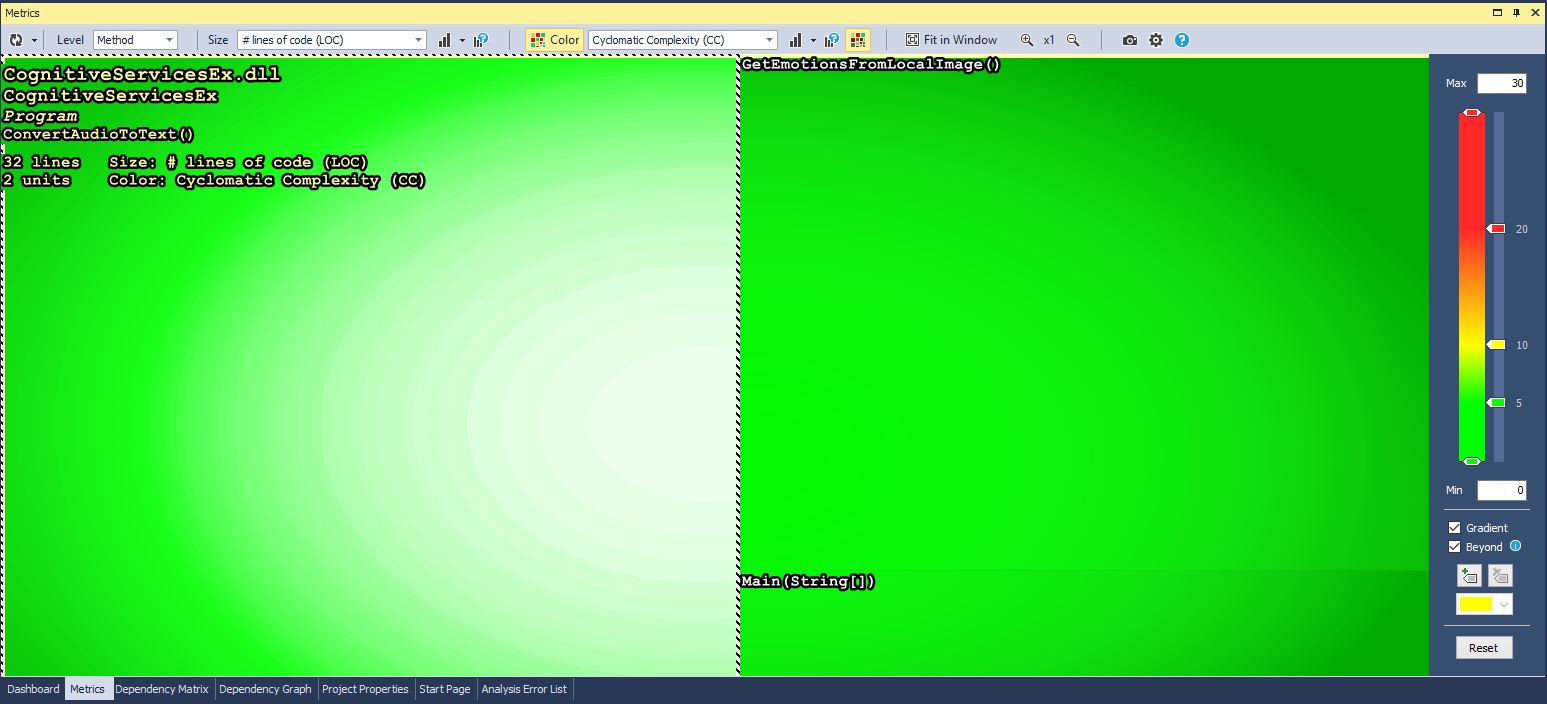
Code Metrics View
Metric View allows visualizing application code metrics to improve understanding of the code base. This view shows, depending on the selected settings, all methods, fields, types, namespaces or assemblies represented by a colored rectangle. By default, the level is set to “Method”, so all the methods grouped by the assembly are shown on the view. The size of each rectangle depends on a number of lines of code and color depends on metric Cyclomatic Complexity. You can easily change any of the settings of this view, including coloring, representation etc.
Summary
Let us summarize all the discussed in the article. Using code analyzer tools does not mean that your code quality will, by magic, become perfect. You need to systematically check the code quality for early detection of problems and analyzers are meant to help with this.
As for NDepend, we tried to make as comprehensive a review as possible without bias. We got the license for free, without any pressure from the NDepend team to write the article or to provide with positive feedback. In defiance of this, after using for some time, we decided that this tool can be really helpful and deserves at least a brief overview of its features. NDepend is a really powerful tool, which provides an objective, impartial review of your code. The ability to customize the analysis for each project carries huge potential. In any case, the only way to decide whether it is 100% suitable for you is to try it out yourself, especially considering that they have a trial version.