Technical debt is the digital equivalent of sweeping dirt under the rug. It might make the room look clean for a quick sprint to the finish line, but eventually, you will trip over the lump it creates. Many engineering leaders struggle with slow releases, but a thorough software development audit can help uncover the hidden code-level root causes. We need to stop guessing and start exploring how to measure technical debt with actionable, realistic frameworks.
What Is a Technical Debt?
Technical debt is the long-term cost of choosing a faster, cheaper, or “good enough” solution today instead of a more durable one. The term was coined by Ward Cunningham in 1992 as a financial metaphor: like financial debt, you can borrow against the future to ship faster now, but you’ll pay interest in the form of slower delivery, more bugs, and developer frustration later. Technical debt typically accumulates from quick fixes, poor documentation, outdated code, and decisions forced by tight timelines.
Let us look at some hands-on examples of technical debt to see the specific issues it can cause. Imagine hardcoding a single currency into an e-commerce platform to hit a holiday launch deadline. When the company decides to expand to Europe a year later, the entire payment infrastructure has to be rewritten, causing a massively delayed launch. Another common example is ignoring minor software updates for third-party libraries. Over time, these outdated dependencies can lead to severe security risks and system outages. Embracing legacy modernization best practices early on is a vital step in minimizing technical debt before it paralyzes your product.
Decoding the Chaos: Types of Technical Debt
Not all shortcuts are created equal, and understanding the nuances is the first step toward better code health. In fact, some debt is taken on intentionally to capture market share, while other debt accumulates silently in the background. To figure out how to measure tech debt effectively, you must first know exactly what you are looking for. Here are the primary types of technical debt you will encounter:
- Code Debt: This is the classic messy code. It includes poor naming conventions, overly complex logic, and a lack of clear documentation that confuses future developers. Check out our code review checklist to identify these hidden code smells early and ensure your foundation remains clean, maintainable, and scalable.
- Design Debt: This occurs when the initial user interface or user experience design no longer scales with the added features, leading to a clunky user journey.
- Testing and Process Debt: Skipping automated tests, ignoring flaky ones, and relying on manual deployment steps creates an unpredictable pipeline. This debt is often invisible to automated code scanners, making it terrifying to add new features and easy to ignore until a release fails catastrophically.
- Architectural Debt: This happens when the foundational technology stack or system architecture is no longer suitable for the company’s current scale.
- Infrastructure and Dependency Debt: This occurs when you rely on outdated frameworks, end-of-life databases, or vulnerable libraries. It creates massive security risks and is a major red flag when measuring technical debt for M&A due diligence.
- Documentation and Knowledge Debt: This occurs when system understanding lives in a single developer’s head rather than in your documentation. If the senior engineer who built a critical system leaves and nobody else fully understands how it works, you are carrying massive risk. According to IBM, measurable indicators like slow onboarding times and excessive developer firefighting hours often point to deeper knowledge debt that pure code analysis misses entirely.
- AI-Generated Debt: This happens when developers use AI augmented development tools to generate code they do not fully understand, changing the landscape of code quality. In fact, 76% of developers believe AI-generated code requires refactoring, and some experts warn that AI can 10x developers in creating tech debt. This often results in code that technically works but leaves the team unable to confidently update or maintain it later. If your team is struggling to untangle machine-generated logic, our vibe code cleanup service can help you regain control and ensure long-term maintainability.
If you are wondering about the hardest types of technical debt to resolve, architectural and infrastructure debt easily take the top spot. Fixing a badly named variable takes seconds, but decoupling a monolithic legacy application into microservices requires foundational rewrites that can halt new feature development for months. Tackling legacy codebases demands a massive investment of time, budget, and specialized engineering talent.
Why Measuring Technical Debt is Non-Negotiable
If you cannot see a problem, you cannot fix it. Left unchecked, bad code will quietly drain your resources and crush your team’s morale. Research from Stripe shows that developers spend an average of 17.3 hours every week dealing with bad code, debugging, and refactoring.
The statistics surrounding software decay are sobering. According to Gartner, approximately 40% of infrastructure systems across asset classes have technical debt concerns. This level of accumulation leads to developer burnout, incredibly slow time to market, and dangerous security vulnerabilities. Proper technical debt management is no longer optional for modern enterprises.
To stay competitive, organizations must invest in measuring technical debt consistently. In fact, research from Accenture suggests that companies need to allocate about 15% of their IT budgets to remediate these issues. Engaging in professional software development consulting can help leadership teams accurately forecast these budgets and translate technical debt measurement into tangible business objectives.
How to Measure Technical Debt: A Step-by-Step Process
Before we get to the metrics, here’s the process and tools to measure technical debt that actually works. This applies whether you’re running a 10-person startup or a 1,000-person engineering org.
Step 1: Define your scope. Pick the systems that matter — actively developed, customer-facing, or that engineers complain about most. For a deeper framework, our SDLC audit checklist walks through how to scope this systematically.
Step 2: Run baseline static analysis. Use SonarQube, CodeScene, or Codacy to scan for code smells, complexity hotspots, duplication, and security issues.
Step 3: Layer in behavioral and process data. Static analysis tells you what’s wrong with the code; process data tells you what’s wrong with how the code is changing. Pull from Git, your CI system, your issue tracker, and your incident tool.
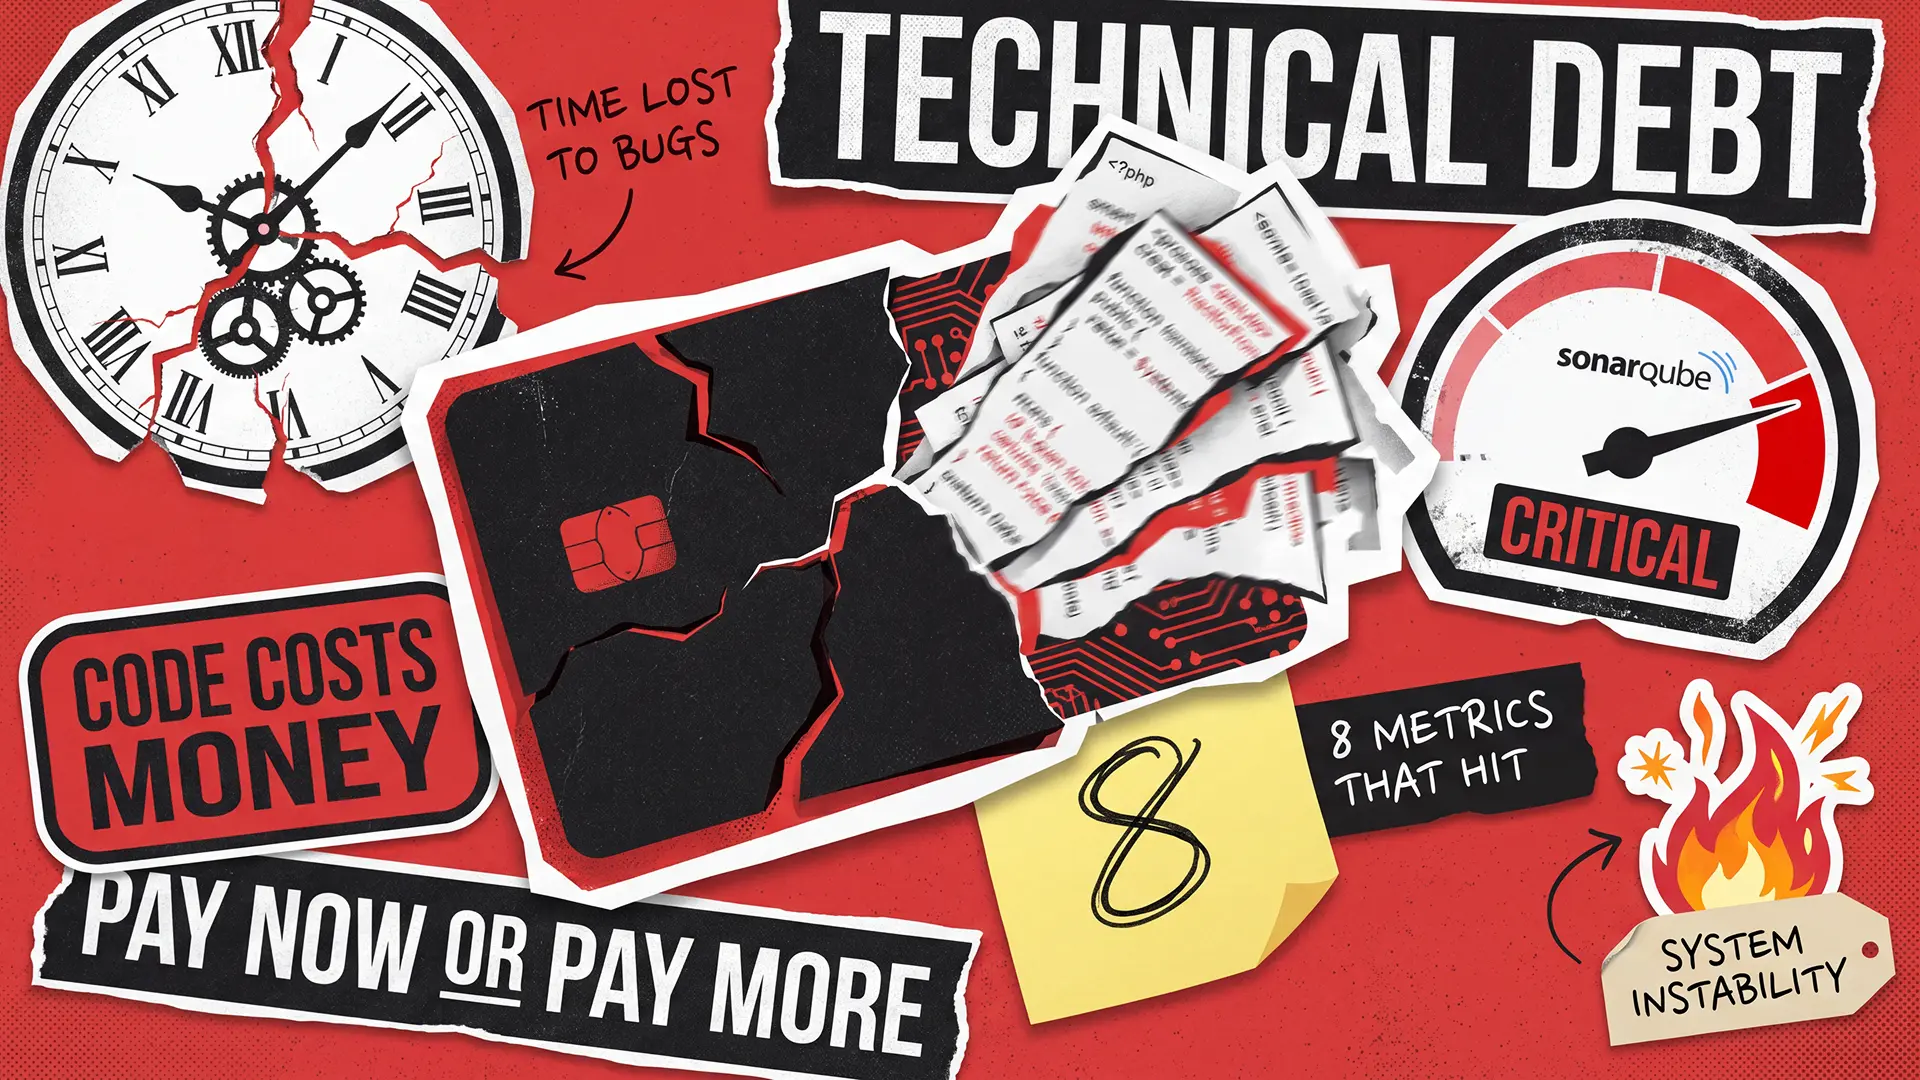
Step 4: Calculate the metrics that matter. Not 30. Eight. Pick the ones most relevant to your stage and type of debt.
Step 5: Set thresholds and review on a cadence. A metric without a threshold is decoration. Define what “act now” looks like, and review monthly with engineering leadership and quarterly with the business.
Step 6: Tie remediation to product planning. Allocate a fixed percentage of every sprint to debt paydown. Shopify reportedly dedicates 25% of development cycles to it.
8 Actionable Technical Debt Metrics
Every guide on the internet lists dozens of vanity metrics that look great on paper but are completely ignored in practice. If you want to actively measure technical debt, you need data that triggers immediate action. Tracking these specific tech debt metrics will give you a crystal clear picture of your platform’s health. Integrating professional code review practices will help you keep these numbers in check.
1. Code Churn in High-Complexity Files
This measures how often developers are forced to edit the most complicated, tangled parts of your codebase. If your team is constantly modifying complex files, it means those areas are fragile and desperately need to be simplified or rewritten.
Source: Git version control combined with SonarQube (or CodeScene for behavioral analysis).
Cadence: weekly.
Threshold: if complex files are being edited in more than 20% of pull requests, it’s time for a modular rewrite.
2. PR Cycle Time Trend
This tracks how long it takes for a pull request to go from the first commit to being officially merged. When this timeframe steadily increases sprint after sprint, it is a clear sign that the code is becoming harder to read, review, and safely integrate.
Source: GitHub or GitLab analytics; tools like LinearB, DX, or Swarmia automate this.
Cadence: sprint-over-sprint.
Threshold: a consistent 15% increase in cycle time over three sprints means the code is becoming too tangled to navigate safely, usually because of review bottlenecks or growing complexity.
3. Defect-Fix-to-Feature Ratio
This compares the effort your team spends fixing bugs against the time spent building new features. A high ratio indicates that technical debt is actively suffocating your innovation because developers are stuck putting out fires.
Source: Jira or Linear.
Cadence: monthly.
Threshold: when the team spends more than 30% of sprint points fixing bugs instead of building features, debt is critical.
4. On-Call Interruption Rate
This counts how often your engineers are paged outside of normal working hours to fix urgent, critical issues. Frequent off-hours alerts usually point directly to deep infrastructure instability and unreliable code.
Source: PagerDuty (or Opsgenie, or your incident platform).
Cadence: monthly.
Threshold: more than three after-hours alerts per week signals severe infrastructure instability. If your on-call engineer can’t sleep, your customers can’t trust your system.
5. Dependency Freshness Index
This evaluates how up to date your third-party libraries, frameworks, and core tools are. Falling behind on these updates introduces severe security vulnerabilities and makes future system upgrades incredibly painful and expensive.
Source: Snyk or Dependabot (Renovate and Mend work too).
Cadence: continuous.
Threshold: any unpatched critical-severity CVE older than 72 hours, or core framework versions lagging more than one major release behind. This is also one of the first things acquirers check during M&A due diligence.
6. Test Flake Rate
This measures the percentage of your automated tests that fail randomly without any actual code changes. Flaky tests destroy developer trust in the CI/CD pipeline and often hide dangerous process debt.
Source: CI/CD pipeline logs.
Cadence: weekly.
Threshold: if more than 2% of tests fail randomly, developers will stop trusting the test suite entirely — once that trust is gone, real failures get ignored too.
7. Time to First Commit for New Hires
This tracks exactly how long it takes a new developer to set up their local environment and push their very first code change. A slow onboarding process is a massive red flag that exposes severe documentation and knowledge debt.
Source: HR and Git data.
Cadence: per new hire.
Threshold: if it takes a senior engineer more than three days to set up their local environment and push a minor fix, your documentation is severely lacking. This is the metric that catches knowledge debt — the kind static analysis can’t see.
8. Percentage of Estimates Exceeded by >50%
This looks at how often development tasks take significantly longer than your team originally planned.
Source: Jira time tracking.
Cadence: quarterly.
Threshold: if 25% of tasks take vastly longer than estimated, the codebase contains hidden “gotchas” destroying predictability.
Tools to Measure Technical Debt: A Quick Comparison
From static code analysis to AI-driven security checks, the market offers a wealth of solutions. The table below compares the best tools to help you streamline your operations.
The right tools to measure technical debt depend on your codebase, your team’s maturity, and the type of debt you’re prioritizing. Here are seven worth knowing.
SonarQube
Code-level analysis at scale
Code smells, complexity, duplication, security
Mature ecosystem, supports 30+ languages
Architectural debt is mostly out of scope
CodeScene
Behavioral code analysis
Hotspots, knowledge gaps, complexity
Combines code with developer behavior data; recognized by Gartner
Steeper learning curve for non-technical stakeholders
Codacy
Quick-start static analysis
Code quality, security, coverage
Easy GitHub/GitLab integration, good for SMBs
Less depth than SonarQube on enterprise codebases
vFunction
Architectural debt in monoliths and cloud apps
Architecture, modularity, dead code
AI-powered; strong for measuring technical debt in cloud-native apps
Higher price point, enterprise-focused
Snyk / Mend
Dependency and security debt
Vulnerable libraries, license issues, outdated deps
Comprehensive vulnerability databases
Limited code-quality analysis
DX / LinearB
Process and delivery metrics
PR cycle time, deployment frequency
Strong on measuring and monitoring technical debt at the team level
Doesn’t analyze code itself
CAST Highlight
Portfolio-level technical debt measurement
Code, architecture, cloud readiness
Used by IBM and large enterprises; benchmarks against peers
Overkill for small teams
We recommend using a combination of architectural-level and code-level tools rather than relying on a single platform. A single tool rarely catches every type of debt in a real-world organization.
Why Partnering With Redwerk Makes Sense
Fixing a chaotic codebase requires more than just running a software tool. It requires a dedicated team of experts who treat your business objectives as their own. Minimizing technical debt is where most teams stall. The actual work of refactoring, modernizing, and rebuilding the parts of your stack that drag you down takes time. Teams often lack the bandwidth, the specialized expertise, or the political cover to pause feature work and pay down debt. But that is exactly what you can achieve with our software maintenance services.
Redwerk has been a trusted software development partner since 2005. Over the past two decades, we have helped multiple companies identify, measure, and pay down technical debt without breaking what is already working.
Here are a few examples in practice:
- Adoorabelle: For this real estate platform, we ran a full software audit that surfaced architectural and security debt the previous vendor had completely missed.
- Pridefit: We rebuilt parts of this fitness app’s backend to reduce the on-call burden and accelerate feature lead time.
- VIP Auslan: For this sign language interpreter booking platform, we first had to reverse-engineer the business logic and functional specifications before we could fix bugs and release new workflow automation features. This effort ultimately saved the client 15 hours per week team-wide.
If you are staring down a codebase you did not write, preparing for an upcoming acquisition, or dealing with a roadmap that keeps slipping for reasons nobody can quite explain, we have been there and done this work many times. We will measure honestly, recommend pragmatically, and help you ship the fix. Ready to trade your technical debt for technical wealth? Feel free to contact us today, and let’s start building a resilient, scalable foundation for your next big launch.
Frequently Asked Questions
What are types of technical debt that slow down DevOps?
The biggest offenders are infrastructure debt (outdated dependencies, end-of-life runtimes), test debt (flaky or missing automated tests), and process debt (manual deployment steps, inconsistent environments). All three increase deployment risk and lengthen lead time.
How do types of technical debt evolve over time?
Code debt compounds first and shows up early. Architecture debt accumulates more slowly but becomes the dominant category once a codebase passes a few years of active development. Knowledge debt spikes whenever there’s senior turnover. AI-generated debt is the newest pattern: it grows in proportion to AI tool adoption, often invisibly, and surfaces later as comprehension and maintenance burden.
What are the best ways to identify all types of technical debt?
The best approach combines automated static code analysis tools to catch syntax issues with regular peer code reviews to identify architectural flaws. Bringing in an external team for a comprehensive software audit is also highly effective.
What are invisible types of technical debt?
The dangerous ones are knowledge debt (information only one person has), comprehension debt (AI-generated code nobody fully understands), and process debt (workarounds and tribal practices that aren’t documented anywhere). They don’t show up in code scans, but they slow your team more than any code smell.
How do companies measure technical debt at scale?
Large organizations build a tech debt portfolio view: each application is scored against a consistent set of metrics, then rolled up by business unit or product line. McKinsey’s Technical Debt Score and CAST’s Highlight platform are two examples. The key is consistency over precision: a slightly wrong score applied uniformly across 200 applications is far more useful than a perfect score on one. For smaller teams, the eight metrics above tracked monthly are enough to make informed decisions.
See how clearing technical debt and releasing new features increased Pridefit's user subscriptions by 45%