No one warns you about the exact moment when your SaaS success starts to feel a lot like a penalty because the need for scaling a SaaS business often hits you out of the blue. It usually happens overnight: the product that ran like a dream at 5,000 users starts wobbling at 30,000, and by 80,000, it’s officially on life support. Suddenly, your support inbox is a burning dumpster fire, your engineers have abandoned your roadmap to become full-time firefighters, and your infrastructure bill is growing way faster than your bank account.
If this sounds painfully familiar, take a deep breath. You haven’t built a bad product, and your team hasn’t forgotten how to code. You’re just paying the ‘success tax’.
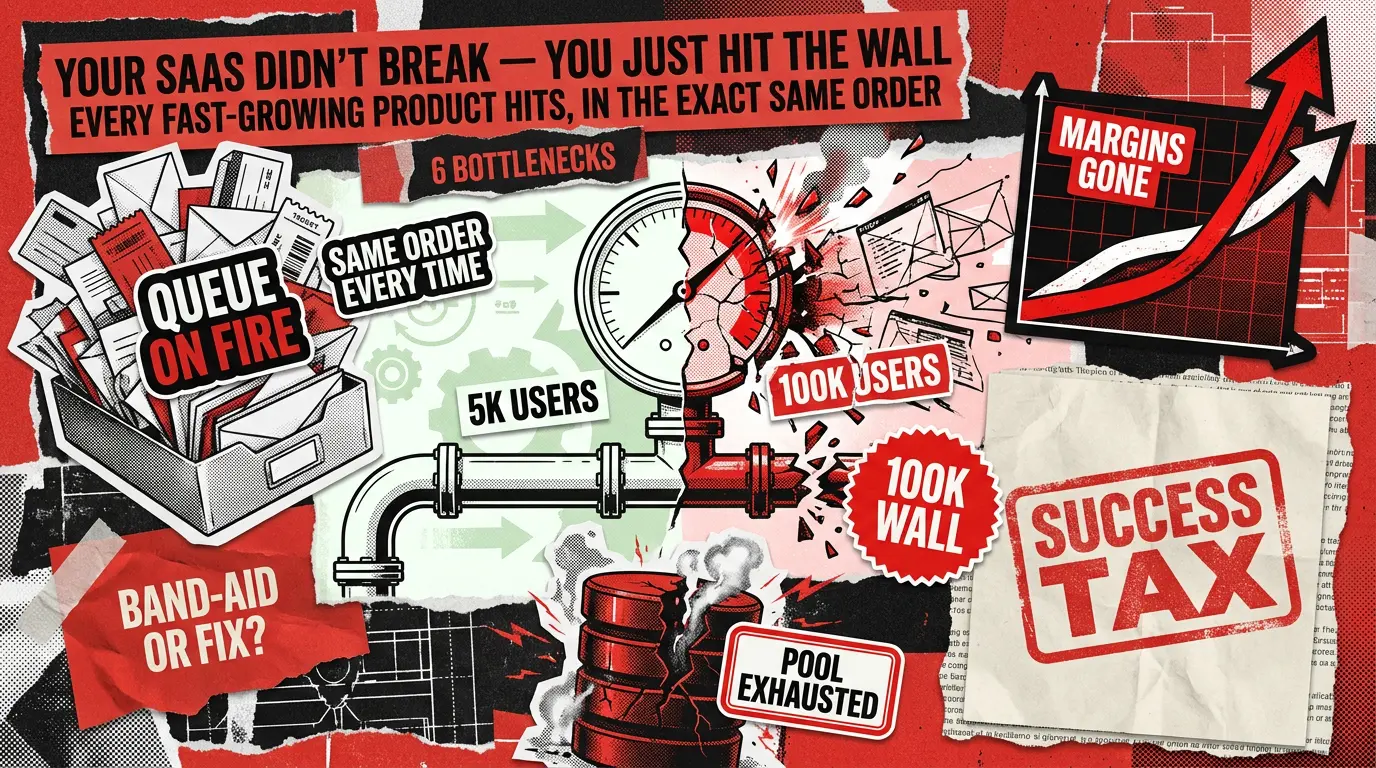
The comforting truth is that none of this chaos is random. After two decades of building and scaling SaaS development projects, we’ve noticed a definitive pattern: bottlenecks love a schedule. They arrive in a highly predictable sequence, triggered by very specific user-count milestones.
If your team knows exactly what’s coming around the corner, you can fix the plumbing before your customers ever notice a leak. That’s the secret sauce separating the SaaS giants that scale effortlessly from the ones that drown in technical debt and user churn.
At Redwerk, we’ve delivered over 250 software projects. That means we’ve watched this scaling horror movie play out enough times to know exactly when the monster is going to jump out.
Consider this article your ultimate survival map. We’re breaking down all six predictable bottlenecks, the exact milestones at which they strike, the early warning signs to look out for, and, most importantly, the difference between a quick, temporary band-aid and a permanent fix. Let’s dive in.
Scaling a SaaS Business: Quick Reference for Bottleneck Diagnostics
The table below summarizes all six bottlenecks covered in this article. Use it as a reference card when you are trying to match what you are seeing in production to its likely cause.
Database connection pool exhaustion
~20K
Random timeouts on actions that were fast yesterday
Active connections vs. pool max; query wait times; ‘too many connections’ errors
Increase pool size, add read replicas
Connection pooler (PgBouncer); separate read/write paths
Background job queue saturation
~40K
Emails arriving 20 minutes late; exports hanging
Queue depth trend; job age at processing; worker wait vs. run time
Add more workers
Priority queue lanes; rate-limit ingestion
Cache invalidation chaos
~60K
Stale data after saves; inconsistent dashboards
Cache hit rate; TTL audit; cross-tenant key collision check
Reduce TTLs globally
Tag-based or event-driven invalidation per tenant
Noisy neighbor degradation
~80K
Specific large accounts slow down unpredictably
Per-tenant query time; shared resource use by tenant ID
Rate-limit the loudest tenant manually
Tenant-tier resource partitioning; dedicated compute pools
Cost-per-user inversion
~100K
Nothing visible yet, but margins are compressing
Cost-per-active-user trend; idle resource ratio; spend vs. revenue per cohort
Reserved instances, spot compute, rightsizing
Cost attribution by tenant; feature-flag heavy workloads
Org and process scaling collapse
~150K
Features slow down; incidents take longer to resolve
MTTD/MTTR trends; deploy frequency; reactive vs. proactive engineering ratio
More process and coordination meetings
Ownership boundaries aligned to services; runbooks; observability investment
What "Scaling a SaaS Business" Actually Means at Each Stage
Most teams walk into a scaling conversation thinking about performance: make things faster, handle more requests. That framing is not wrong, but it is incomplete. Scaling really means identifying what will break next and addressing it before users do.
Each growth stage introduces one dominant constraint. The instinct to throw compute resources at a problem or to rewrite the entire architecture at once tends to be expensive precisely because it overlooks this point. The right move is almost always narrower: find the specific constraint at your current stage, fix it properly, and instrument for the next one coming.
The six sections below walk through each constraint in the order it typically arrives.
1. Why SaaS Slows Down at 20K Users: Database Connection Pool Exhaustion
Actions that have been fast for months start timing out intermittently. The failures tend to cluster during business hours, when concurrent usage is highest, and then disappear by evening. Users raise tickets, so your team checks the database and finds it running well within capacity. So what is happening?
Why This Happens When Scaling a SaaS
Your application maintains a pool of open database connections that requests can borrow and return. At low user counts, this pool is large enough relative to concurrent demand. As your monthly active user (MAU) count climbs toward 20,000, the number of simultaneous requests finally exceeds the pool. New requests queue up waiting for a connection to become available. If the wait exceeds the request timeout, the user sees an error. Meanwhile, the database itself looks fine because the bottleneck is in the connection management layer, not the database engine.
This scenario is more common than most teams expect. As one engineering team discovered after profiling their own system, connection pool exhaustion can cause P99 latency spikes even when the database itself is at 47% utilization. What looks like a database capacity problem is actually congestion in the connection queue.
3 Signs to Look for in Your System
- Active connection count vs. your configured pool maximum (are you regularly hitting the ceiling?)
- Query wait time in your database’s process activity view (pg_stat_activity in PostgreSQL, or the equivalent in your engine)
- Error logs for ‘too many connections’, ‘pool exhausted’, or similar messages, cross-referenced against timestamps of user complaints
Quick Relief vs. Lasting Solution
The band-aid is to increase your pool size and add read replicas to buy time. The architectural fix is introducing a dedicated connection pooler, such as PgBouncer running in transaction mode, which multiplexes many application connections into far fewer database connections. Alongside this, you should decouple your read path (dashboard queries, reporting) from your write path so they do not compete for the same pool.
2. A Common SaaS Scaling Problem at 40K Users: Background Job Queue Saturation
Email confirmations that should arrive in seconds now take 20 minutes. File exports that used to be ready instantly show a spinner for a long time, then silently fail. Webhooks to your customers’ systems stop delivering. None of these failures show up as errors on your main dashboard, which makes this bottleneck particularly insidious.
Why This Happens When Scaling a SaaS
As your user count grows, the volume of work your background job system needs to process grows with it, often faster than the user count itself because many user actions trigger multiple background tasks. Eventually, the queue accumulates faster than your workers can drain it. New jobs wait behind a backlog. Time-sensitive tasks like emails sit in line behind heavy batch exports. Workers appear busy, but most of their wall-clock time is spent waiting, not running.
This is dangerous specifically because the failures are silent. Enterprise customers notice before you do, because their webhook integrations start missing events. By the time the support tickets arrive, trust has already been damaged.
3 Signs to Look for in Your System
- Queue depth trend over the last 24 hours (is it growing over the course of the day instead of staying flat?)
- Job age at the time of processing (are jobs waiting 15 minutes before they even start?)
- Worker CPU vs. wall-clock time ratio (workers that spend most of their time waiting, rather than executing, signal a throughput bottleneck, not a capacity one)
Quick Relief vs. Lasting Solution
The quick fix is adding more workers. This helps temporarily but often creates a new problem: heavy batch jobs compete with time-sensitive user-facing jobs, and the queue fills up again within weeks. The architectural fix is prioritized queue lanes, with separate dedicated queues for user-facing tasks (emails, in-app notifications, webhook delivery) and internal batch work (exports, analytics aggregation, search indexing). Pair this with rate-limiting on the ingestion side so that a sudden spike of new events cannot bury your priority queue.
3. Stale Data and Broken Dashboards: Cache Invalidation Problems at 60K Users
A user saves a change, and the page still shows the old data. Two people on the same account see different numbers in the same dashboard. A deleted record keeps reappearing, and your support team starts logging these as bugs. When your engineering team investigates, the underlying data in the database is correct; the cache is simply serving an outdated version.
Why This Happens When Scaling a SaaS
Caching is one of the most effective tools for reducing database load as a SaaS product scales. However, cache invalidation, deciding when a cached value is no longer valid and should be replaced, is genuinely one of the harder problems in distributed systems. At 60,000 MAU, the failure modes that were manageable at a smaller scale become visible. In multi-tenant environments, a common issue is cache key collisions: two tenants’ data is keyed in overlapping ways, so one tenant’s write accidentally serves stale data to another. Another is over-relying on time-to-live (TTL) expiry, which means stale data persists for as long as the TTL is, even if the underlying record changes seconds after the cache is written.
3 Signs to Look for in Your System
- Cache hit rate broken down by endpoint (a sudden drop in hit rate often precedes visible staleness complaints)
- TTL distribution audit across your cached objects (are high-traffic objects using TTLs that are longer than your users’ tolerance for stale data?)
- Cross-tenant cache key collision check in your multi-tenant environment (are your keys scoped tightly enough to the tenant and resource version?)
Quick Relief vs. Lasting Solution
|The first thing to do is to reduce TTLs across the board. This cuts the window for stale data but significantly increases database load, which often triggers other problems. The architectural-level solution is to move to tag-based or event-driven invalidation, where a write to a resource explicitly invalidates all cached views of that resource, keyed by tenant ID and resource version. Alongside this, switch to write-through caching on your hottest read paths, so the cache and the database are updated together on every write. For further guidance on structuring tenant isolation in your cache layer, review our guide to multi-tenant SaaS architecture best practices.
4. Noisy Neighbor Degradation: A Multi-Tenant SaaS Scaling Challenge at 80K Users
Your largest, most valuable accounts start complaining about slowdowns. The timing is inconsistent and does not correlate with anything obvious on their end. What looks like their problem is actually caused by a different account consuming shared infrastructure at the same time.
Why This Happens When Scaling a SaaS
In a multi-tenant architecture, multiple customers share the same database, application servers, and cache infrastructure. A single large tenant whose usage is legitimately heavy, running a complex export, processing a bulk import, or running analytics queries, can consume a disproportionate share of shared resources. Other tenants on that same infrastructure get degraded performance as a result. This is the noisy neighbor problem, and it typically becomes visible around 80,000 MAU, because that is usually when the distribution of tenant sizes becomes wide enough for the heaviest tenants to genuinely compete with everyone else.
3 Signs to Look for in Your System
- Per-tenant query time percentiles (do your slowest P95 periods correlate with one or two specific tenant IDs consuming more resources than others?)
- Shared resource utilization broken down by tenant ID (storage IOPS, connection count, CPU)
- Connection count per tenant during the complaint windows
Quick Relief vs. Lasting Solution
The band-aid is manually rate-limiting the loudest tenant when a complaint arrives. This is reactive, as it damages your relationship with that tenant and does not prevent the same scenario from recurring next week with a different tenant. The architectural solution is tenant-tier-based resource partitioning: high-usage accounts get dedicated compute pools or database schemas with their own resource allocations, while smaller accounts share a common pool sized appropriately for their aggregate usage patterns. This also opens a natural path to tiered pricing, where enterprise customers pay for dedicated infrastructure.
5. When Scaling a SaaS Business Gets Expensive: Cost-Per-User Inversion at 100K Users
This one is invisible to your customers, which is part of what makes it dangerous.
What Your Team Notices
The infrastructure bill grew three times over the last six months. Your user count grew by about 50% in the same period. The math that looked compelling in your unit economics model no longer works. According to Flexera’s 2025 State of the Cloud Report, 84% of organizations identify managing cloud spend as their top cloud challenge, with cloud budgets already exceeding forecasts by 17% on average. SaaS products hit this wall acutely around 100,000 MAU because that is where architectural inefficiencies that were tolerable at a smaller scale start compounding into real margin erosion.
Revenue in SaaS grows per seat or per plan. Infrastructure costs grow per interaction: every API (application programming interface) call, every database query, every gigabyte stored or transferred. When those curves stop being proportional, you have a cost-per-user inversion, and if you do not address the underlying architecture, the inversion worsens as you grow.
3 Signs to Look for in Your System
- Cost-per-active-user trend over the last 90 days (not total spend, but spend divided by MAU, tracked week over week)
- Idle resource ratio (what percentage of your provisioned compute is idle during off-peak hours?)
- Compute spend vs. revenue broken down by customer cohort (are certain plan tiers or feature sets genuinely unprofitable at current infrastructure costs?)
Quick Relief vs. Lasting Solution
You can try rightsizing instances, moving to spot compute for non-critical workloads, and purchasing reserved capacity. These measures are worthwhile and should be implemented, but they are optimizations, not architecture. Fixing the issue at the architectural level requires cost attribution by tenant, so you know exactly what each customer actually costs to serve, and feature flagging of heavy workloads so that resource-intensive features are only active for tiers whose pricing supports the cost. Additionally, a review of your data retention and log storage policies almost always reveals significant waste at this stage: data you are paying to store that nobody is querying.
6. The Hidden SaaS Scaling Challenge at 150K Users: Org and Process Collapse
Feature releases slow down noticeably. When something breaks, the resolution takes longer than it used to. Customer onboarding, which used to take a week, now takes three. Your NPS (net promoter score) starts to drift downward even though the product itself has not gotten worse.
What Your Team Notices
A production deployment now requires coordinating four or more people. Nobody has a clear picture of how all the services interact. When an incident occurs, half the time is spent figuring out whose area it belongs to. Support tickets reference behaviors that engineering cannot reproduce in a staging environment. The ratio of reactive work (fixing things that are already broken) to proactive work (building things that have not broken yet) has quietly inverted.
Why This Happens When Scaling a SaaS
This is the bottleneck that most articles on scaling a SaaS business skip, because it feels organizational rather than technical. But it is just as predictable and just as damaging as the five before it. Around 150,000 MAU, the number of people on your team and the number of services they are responsible for have grown to the point where informal coordination no longer works. The cognitive overhead of keeping shared context becomes too high, so decisions slow down. A software development audit at this stage often reveals that the technical symptoms, deployment failures, unreproducible bugs, and monitoring gaps are downstream of structural problems in how ownership and observability are organized.
3 Signs to Look for in Your System
- Mean time to detect (MTTD) and mean time to resolve (MTTR) trends for incidents over the last six months (both should be decreasing as a product matures; if they are increasing, that is a structural signal)
- Deploy frequency per team or service (are deploys becoming less frequent and more ceremonial?)
- Ratio of reactive to proactive engineering work over the last quarter (if the team is spending more than 40% of its time on reactive work, the organization has a structural problem, not just a backlog problem)
Quick Relief vs. Lasting Solution
The band-aid fix is adding more process: more meetings, more approval steps, more documentation requirements. These feel like solutions because they temporarily reduce the chaos, but they also slow everything else down. The proper architecture-level fix explicitly aligns ownership boundaries with services, so every component of the system has a named team responsible for it. It means on-call rotations with written runbooks, not just informal knowledge. It means investing in an observability platform so that when something breaks, the team can see what happened and why, rather than having to reproduce it by guesswork.
How to Know Which SaaS Scaling Challenge You Are Facing Right Now
The sequence above is not rigid to the day, but it is reliable in its order. Therefore, if your product is around 20,000 to 40,000 MAU and you are seeing intermittent timeouts, start with section 1. If you are around 60,000 to 80,000 MAU and your support queue is filling with ‘the data looked wrong’ complaints, start with section 3. If you are past 100,000 MAU and your unit economics have quietly softened, the cost-per-user inversion in section 5 is the most likely culprit.
The key discipline is running the three-sign checks for the section that matches your current stage before assuming you know the answer. The symptoms at each stage can look deceptively similar from the outside, and the fixes are different enough that confusing them is expensive. A well-designed, scalable software architecture is one in which instrumentation for the next bottleneck is already in place before the bottleneck arises.
When to Bring in Outside Help for Your SaaS Product Scaling Challenges
The point where most teams seek outside help is typically one bottleneck too late. There are three reliable signals that self-diagnosis is no longer the right approach.
- First, your monitoring does not cover the signals that matter for your current stage. You cannot fix what you cannot measure, and if the three signs above are returning no data, the observability gap is the first thing to address.
- Second, your team is repeatedly fighting fires in the same area. If the same category of incident has occurred three or more times in the last quarter, a band-aid was applied each time rather than the architectural fix.
- Third, the architectural decisions made 12 to 18 months ago are now the constraint. Most SaaS products are designed for the user count they have today, not the user count they expect in 18 months. When growth accelerates, the gap between the current and required architecture can be too large for a team to close while maintaining the product.
If any of those describe your situation, it’s time to have a structured conversation about what needs to change and in what order, so give us a call.
FAQ
How do you scale a SaaS application?
Scaling a SaaS business application is less about ‘making it faster’ and more about identifying which specific constraint becomes the bottleneck at your current user count, fixing it properly, and instrumenting for the next one. Each stage is listed in the article above, and it has a distinct set of symptoms, a confirmation method, and an architectural fix that differs from the temporary band-aid. Teams that scale cleanly are the ones that address each bottleneck at its architectural root, not just its surface symptom.
What are common SaaS scaling problems?
The most common SaaS scaling problems, roughly in the order they appear as user count grows, are:
- Database connection exhaustion (where the application runs out of available database connections under concurrent load)
- Background job queue saturation (where asynchronous tasks like emails and webhooks accumulate faster than workers can process them)
- Cache invalidation failures (where stale data is served to users after updates)
- Noisy neighbor degradation (where one large tenant’s usage degrades performance for other tenants on shared infrastructure)
- Cost-per-user inversion (where infrastructure costs grow faster than revenue as usage increases)
- Organizational process failure (where coordination overhead slows down engineering as team and system complexity grows)
Why does my SaaS slow down as users grow?
SaaS applications slow down as users grow because the architecture that works well at low user counts has specific capacity limits that become binding as concurrency increases. The most common early cause is database connection pool exhaustion: the application cannot open new database connections fast enough to serve all concurrent users, so requests queue up and time out. As the user count grows, background job queues fill, caching layers serve stale data, and shared infrastructure begins to show contention between tenants. Each of these failures has a predictable trigger point, which means they are diagnosable and preventable if the right instrumentation is in place before the user count reaches the threshold.
See how we helped Recruit Media build a recruitment SaaS acquired by a Nasdaq-listed company with a 250+ mln market cap