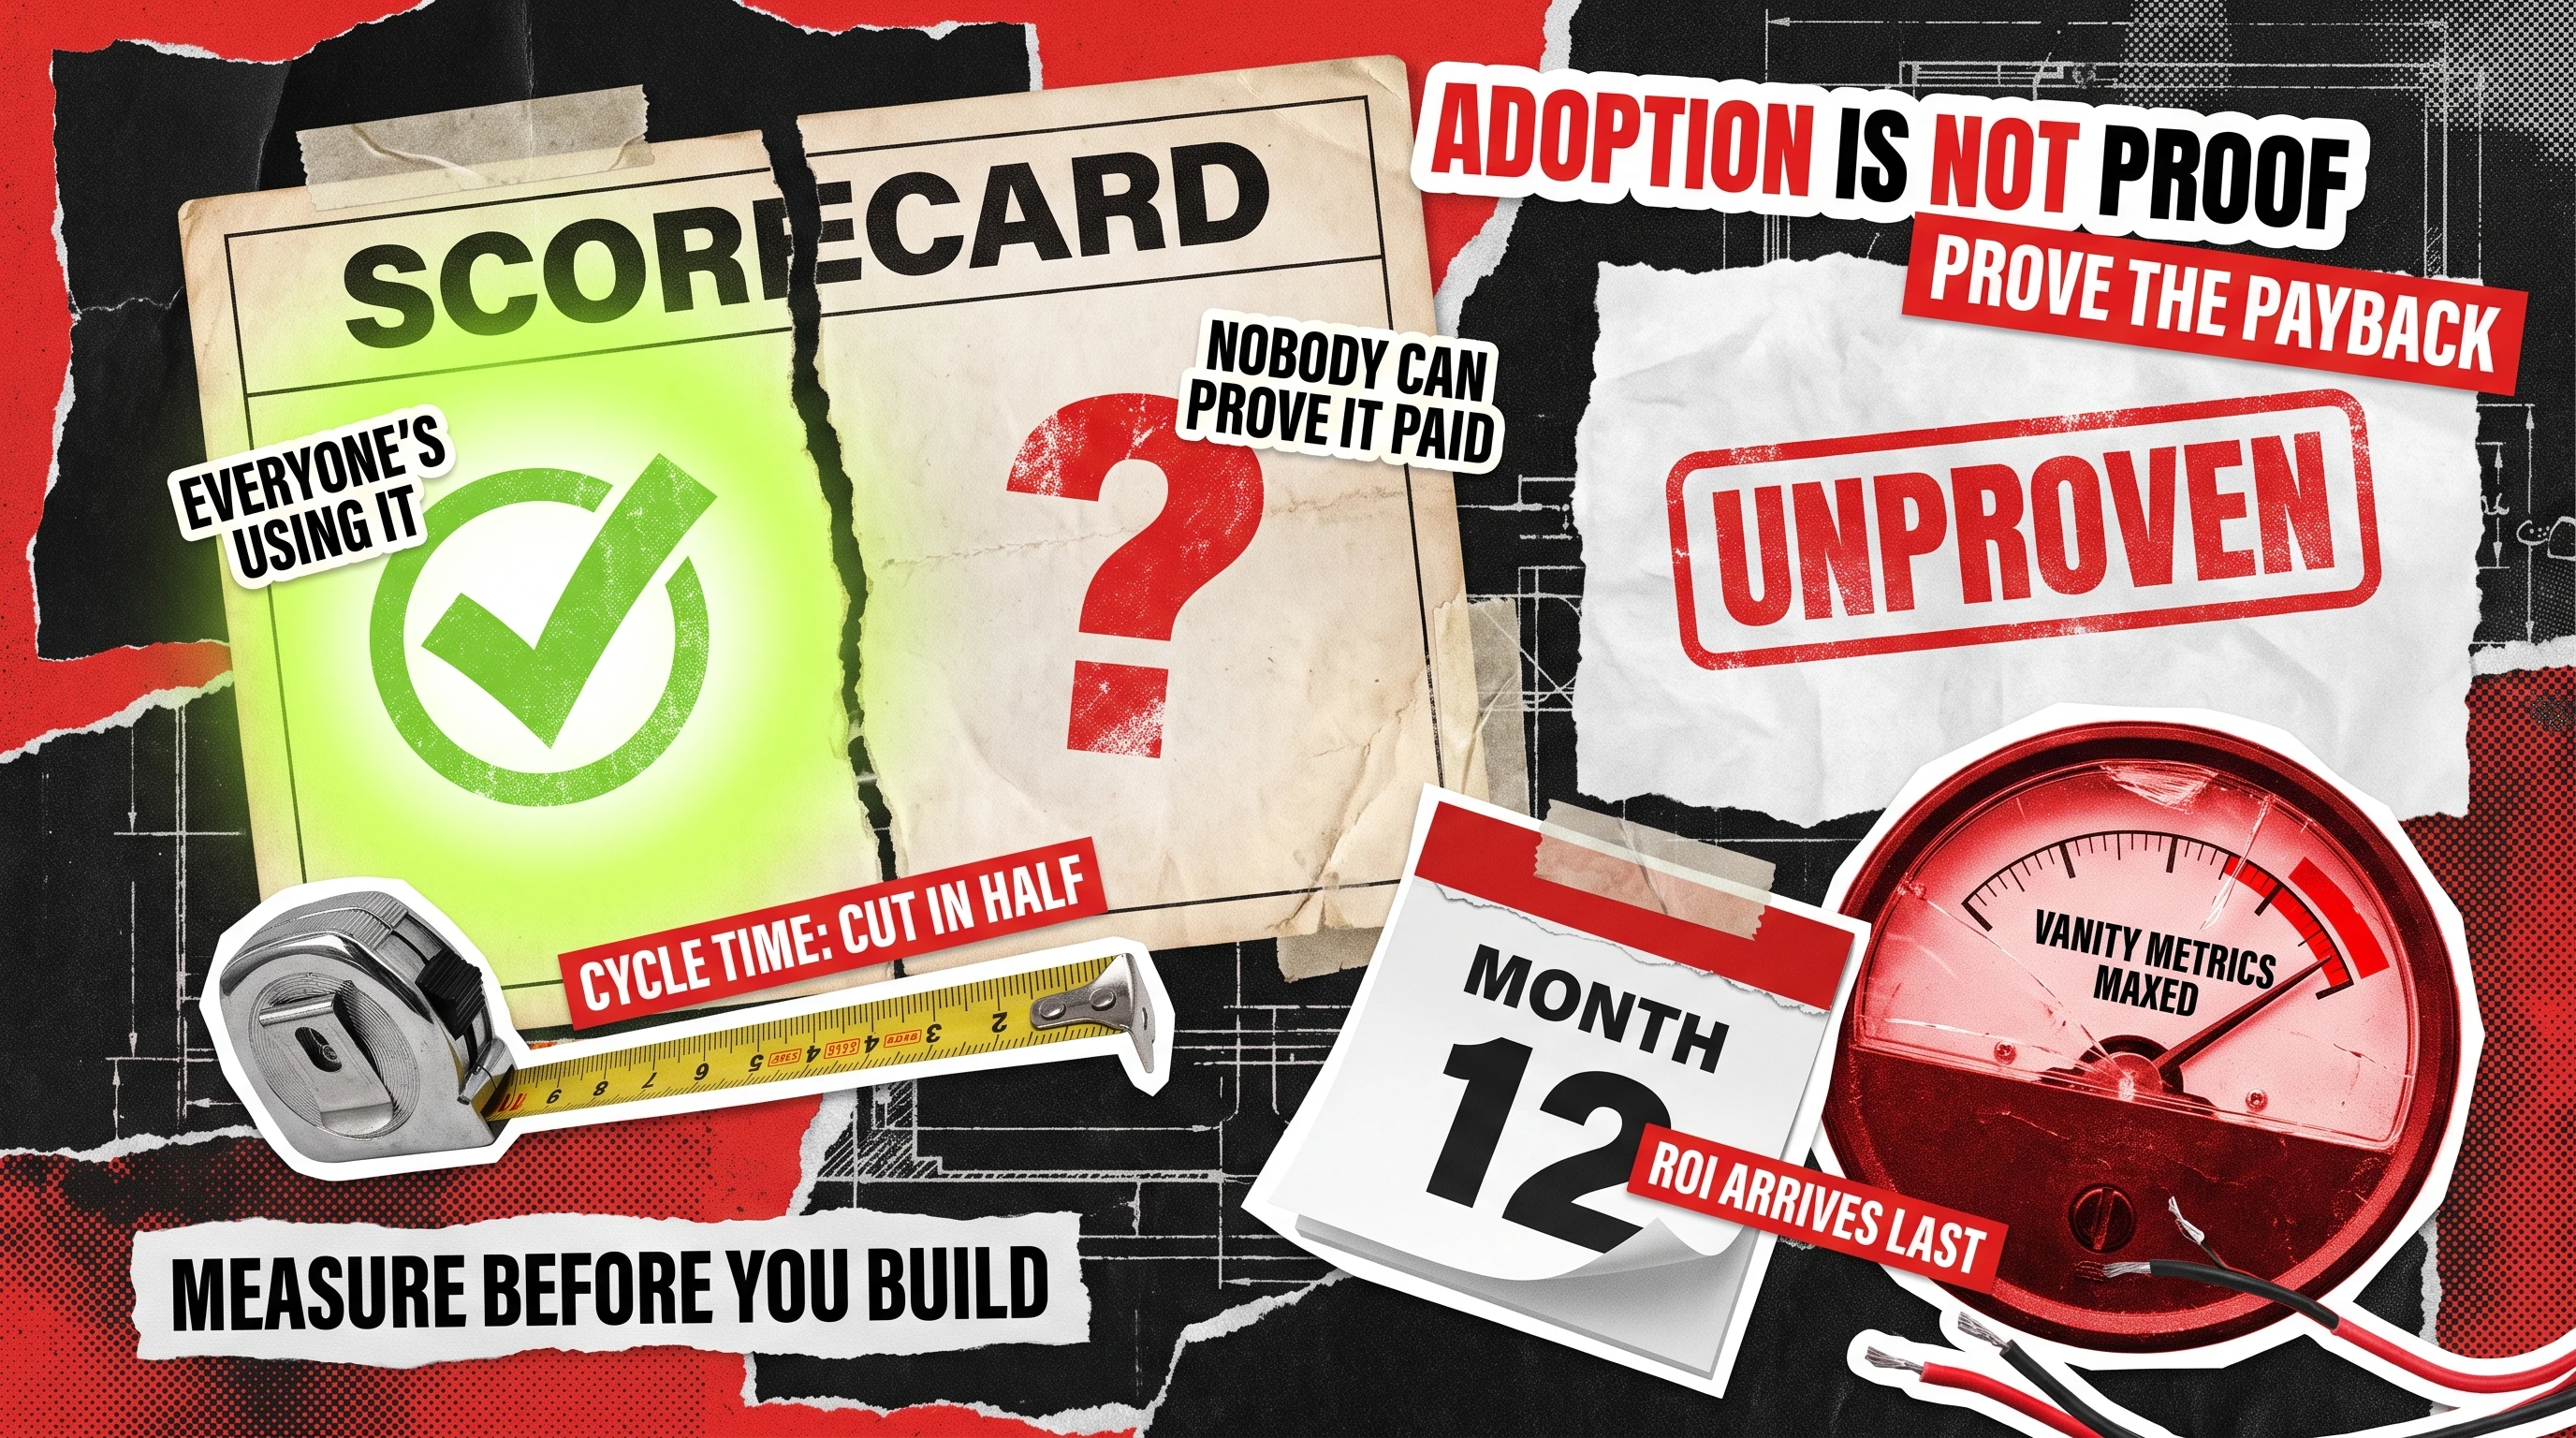
You approved the budget, the new platform shipped on time, and the adoption dashboard looks healthy. Then your CFO asks for the one number that proves the spend paid off, and you realize you cannot produce it. That gap is the most common reason a technically successful transformation still gets written up as a failure.
Knowing how to measure digital transformation comes down to tracking it in three layers at once: adoption (are people actually using the new system), operational metrics (is the work getting faster or cheaper), and financial ROI (is it paying back). No single layer proves value on its own. Read together against a recorded baseline and a realistic timeline, they show whether the change is genuinely working.
Why Measuring Digital Transformation Is Harder Than It Looks
The money is flowing faster than the proof. Gartner now puts worldwide AI spending, the single largest driver of transformation budgets, at $2.59 trillion in 2026, up 47% year over year. Adoption has followed: McKinsey found that 88% of organizations use AI in at least one business function. Yet in that same study only 39% reported any measurable impact on enterprise earnings, and most of those said it accounted for less than 5% of profit.
That is the real problem in a single statistic. Usage is nearly universal, and provable financial impact is rare. The difficulty is not a matter of transformations failing to work. It is that four things make the result genuinely hard to read.
- Attribution. A transformation touches many systems at once, so isolating which change moved a revenue or cost number is rarely clean.
- Lag. The cost lands immediately while the benefit shows up months later, which makes early snapshots look like losses.
- Baseline drift. Almost nobody records the before numbers, so when the question finally comes there is nothing honest to compare against.
- Vanity signals. Dashboards default to what is easy to count, like logins and tickets closed, rather than what changed for the business.
The same blind spot shows up in engineering economics, where teams ship for years without ever quantifying the drag of accumulated shortcuts, a discipline we break down in how to measure technical debt. Most of it traces back to a program that launched with no measurement plan, which is why a sound digital transformation strategy treats metrics as a deliverable rather than an afterthought. Good digital transformation metrics are decided before the first line of code, not reverse-engineered under pressure from finance.
How to Measure Digital Transformation: The Three-Layer Framework
The three layers are not independent scorecards, they stack. Adoption is the leading signal that predicts everything downstream, operational metrics turn that usage into measurable efficiency, and financial ROI is the lagging result the board actually funds. Reading them in order tells you not only whether the transformation is working, but where it is stuck when it is not.
Each layer also answers a different stakeholder, which is why one top-line number never satisfies everyone in the room. The table below maps who cares about what.
Adoption
Is anyone actually using it?
Weekly active users, share of processes migrated, drop in parallel tool use
Product and operations leads
Operational
Is work getting faster or cheaper?
Cycle time, cost per transaction, error and rework rate
Engineering and operations managers
Financial ROI
Is it paying back?
Payback period, net benefit, cost per outcome
The CFO and the board
Adoption Metrics: Is Anyone Actually Using It?
Adoption is the cheapest layer to measure and the one most teams skip, because it feels obvious. It rarely is. A platform can pass every acceptance test and still sit idle while staff quietly keep working in the old spreadsheet, which is the exact pattern behind most of the stalled and abandoned builds we are asked to rescue.
Track usage as a share of the target, never as a raw count. The numbers worth watching are simple:
- Weekly active users as a percentage of the people the system was actually built for.
- Share of real processes moved off the legacy system, rather than just accounts created.
- The decline in parallel or shadow usage, meaning the old tool and the side spreadsheet finally going quiet.
When adoption stalls, the fix is almost always change management or workflow design, not more engineering. That distinction protects budgets, because throwing features at an adoption problem is how a working system ends up getting rebuilt twice.
Operational Metrics: Is Work Getting Faster or Cheaper?
Once people are genuinely using the system, operational metrics measure what that usage changed about the work itself. These are the most trustworthy digital transformation success metrics because they sit close to the process and are hard to fake, since a cycle time is either shorter or it is not.
The strongest four to instrument are cycle time (how long a task takes end to end), cost per transaction, error and rework rate, and throughput per person. A logistics team automating an order step, for example, might watch processing time per order fall from tens of seconds to a few, and that figure is defensible in a way a satisfaction score never is. Capture each one against the baseline you recorded before the change, because an improvement you cannot compare to a starting point is just a number floating on its own.
Financial ROI: Is It Paying Back?
Financial ROI converts the operational gains into the language the board funds the next phase in. The calculation is straightforward, even when gathering the inputs is not: net benefit over a period divided by the total cost of the change, expressed as a percentage or a payback period in months.
The discipline is in counting honestly on both sides. Costs include the build, licenses, change management, and ongoing maintenance, not just the invoice for development. Benefits include labor hours saved multiplied by a loaded hourly cost, the cost of errors avoided, revenue from capabilities that did not exist before, and reduced churn. This is the layer boards care about, and it is where an experienced digital transformation partner earns the mandate for the next phase, because a defensible digital transformation ROI number is what turns a completed project into a funded program.
The Metrics to Stop Tracking
Half of measuring well is refusing to measure the wrong things. Activity metrics feel productive and reassure a steering committee, yet they describe motion rather than outcomes, and they crowd out the numbers that matter. The trap is mistaking activity for digital transformation ROI metrics, since a dashboard full of logins tells you the lights are on, not that the business changed.
These are the usual offenders worth retiring, or at least demoting out of any executive report:
- Raw login counts and page views, which rise with curiosity and fall with habit.
- Features shipped or story points burned, which measure the team rather than the outcome.
- Percent complete against the roadmap, which tracks the plan instead of its effect.
- A migration percentage treated as the goal itself, when moving to the cloud is the enabler and not the return.
- A generic satisfaction score untied to the specific workflow that actually changed.
None of these are useless for a delivery team mid-build. They simply fail to answer the question an executive is really asking, which is whether the organization is measurably better off than before.
Leading Indicators That Predict Success Before Revenue Moves
Financial results arrive last, often a year or more after go-live, which is far too late to steer by. Leading indicators are the early, directional signals that a transformation is on track to pay off, and they let you correct course while correction is still cheap. Where adoption tells you how much the system is used, leading indicators tell you which way the outcome is trending before the money confirms it.
A few of them reliably predict the lagging result: the time it takes a new user to reach first productive use, the trend in support ticket volume and type as friction drops, the share of transactions flowing through the new path rather than the old one, and how quickly staff time is reallocated away from the work the system replaced. When these move in the right direction in the first months, the ROI almost always follows. When they stay flat, patience alone will not rescue the business case, and that is the signal to intervene early.
When Each Metric Should Actually Move
A metric that has not moved is only a problem if it was due to move by now. Setting an expected-move date for each layer up front turns measurement into a diagnostic instead of a postmortem, because a flat number on a known schedule points straight at the cause. The rough sequence holds across most programs, even though the exact weeks shift with scope.

- Adoption should climb within the first four to eight weeks. Flat adoption at week eight is a change-management problem, not a technology one.
- Operational metrics should shift in months two to six, once usage is steady and the process has settled into its new shape.
- Financial ROI typically lands between month six and month eighteen. If operational metrics improved but ROI has not by month twelve, the savings are real yet uncaptured, usually because headcount was never reallocated or old licenses were never retired.
Sequencing these expectations is exactly what a digital transformation roadmap is for, tying each phase to the metric that should have moved by the time it ends. For AI-heavy programs, where McKinsey finds only about a third of organizations have scaled their AI initiatives past a pilot, the timing gap runs even longer, because an AI workflow build often needs months of real usage before the model and the surrounding process settle enough to produce a stable number.
Building the Measurement Framework Before You Spend
Everything above is far easier to do before the build than after it, and the difference is mostly about writing things down while the before still exists. A measurement framework does not need a finished specification to start, which matters because so many transformations begin without one. You can baseline a process you have not yet redesigned, and in practice that early baseline is the single highest-leverage hour in the whole program.
A framework that survives contact with a real project usually comes down to five moves:
- Record the baseline now, capturing current cycle time, cost per transaction, and error rate before anything changes.
- Pick one primary metric per layer rather than twenty, so the signal is not buried under noise.
- Assign an owner and a review cadence to each metric, because an unowned number quietly stops being updated.
- Set the expected-move date for each metric, so a flat result triggers a question instead of a shrug.
- Build the instrumentation to emit that data as a requirement, not a retrofit bolted on once someone asks for a report.
This is the part of the work that benefits most from a team that has measured transformations before and can name the baseline you forgot to capture. It is also where fast, honest communication matters more than raw engineering, because the framework only holds if the people running the process trust the numbers and understand what each one is telling them.
A transformation that works but cannot prove it is one budget cycle away from being cancelled. The organizations that keep their funding are not the ones with the flashiest platforms, they are the ones that decided what success looked like before they spent, recorded the baseline, and watched adoption, operations, and payback move on a schedule they set in advance. Measurement is not the paperwork that trails the project, it is the thing that keeps the project alive.
If you want a partner who builds the measurement in from day one and can show you exactly what moved, contact us to talk through your program.
FAQ
How do you measure digital transformation?
Measure it in three layers at once. Adoption shows whether people use the new system, operational metrics show whether the work got faster or cheaper, and financial return shows whether it paid back. Track all three against a baseline you recorded before the change, because any one layer on its own can mislead.
How do you calculate the ROI of digital transformation?
Divide the net benefit over a set period by the total cost of the change, then read it as a percentage or a payback period in months. Count every cost, including licenses, change management, and maintenance, and count benefits such as labor hours saved, errors avoided, and new revenue. The honesty of the inputs matters more than the elegance of the formula.
What KPIs measure digital transformation success?
The most reliable KPIs sit close to the work: weekly active users as a share of target, cycle time, cost per transaction, error and rework rate, and payback period. Avoid activity counts like logins and features shipped, which show motion rather than results. One strong KPI per layer beats a crowded dashboard.
Why is digital transformation ROI so hard to measure?
Because the cost lands immediately while the benefit arrives months later, many systems change at once so attribution is messy, and most teams never recorded the before numbers to compare against. The fix is to define success and capture the baseline before the program starts, rather than after finance asks for proof.
See how we helped a recruitment platform cut business operations time in half through workflow automation.