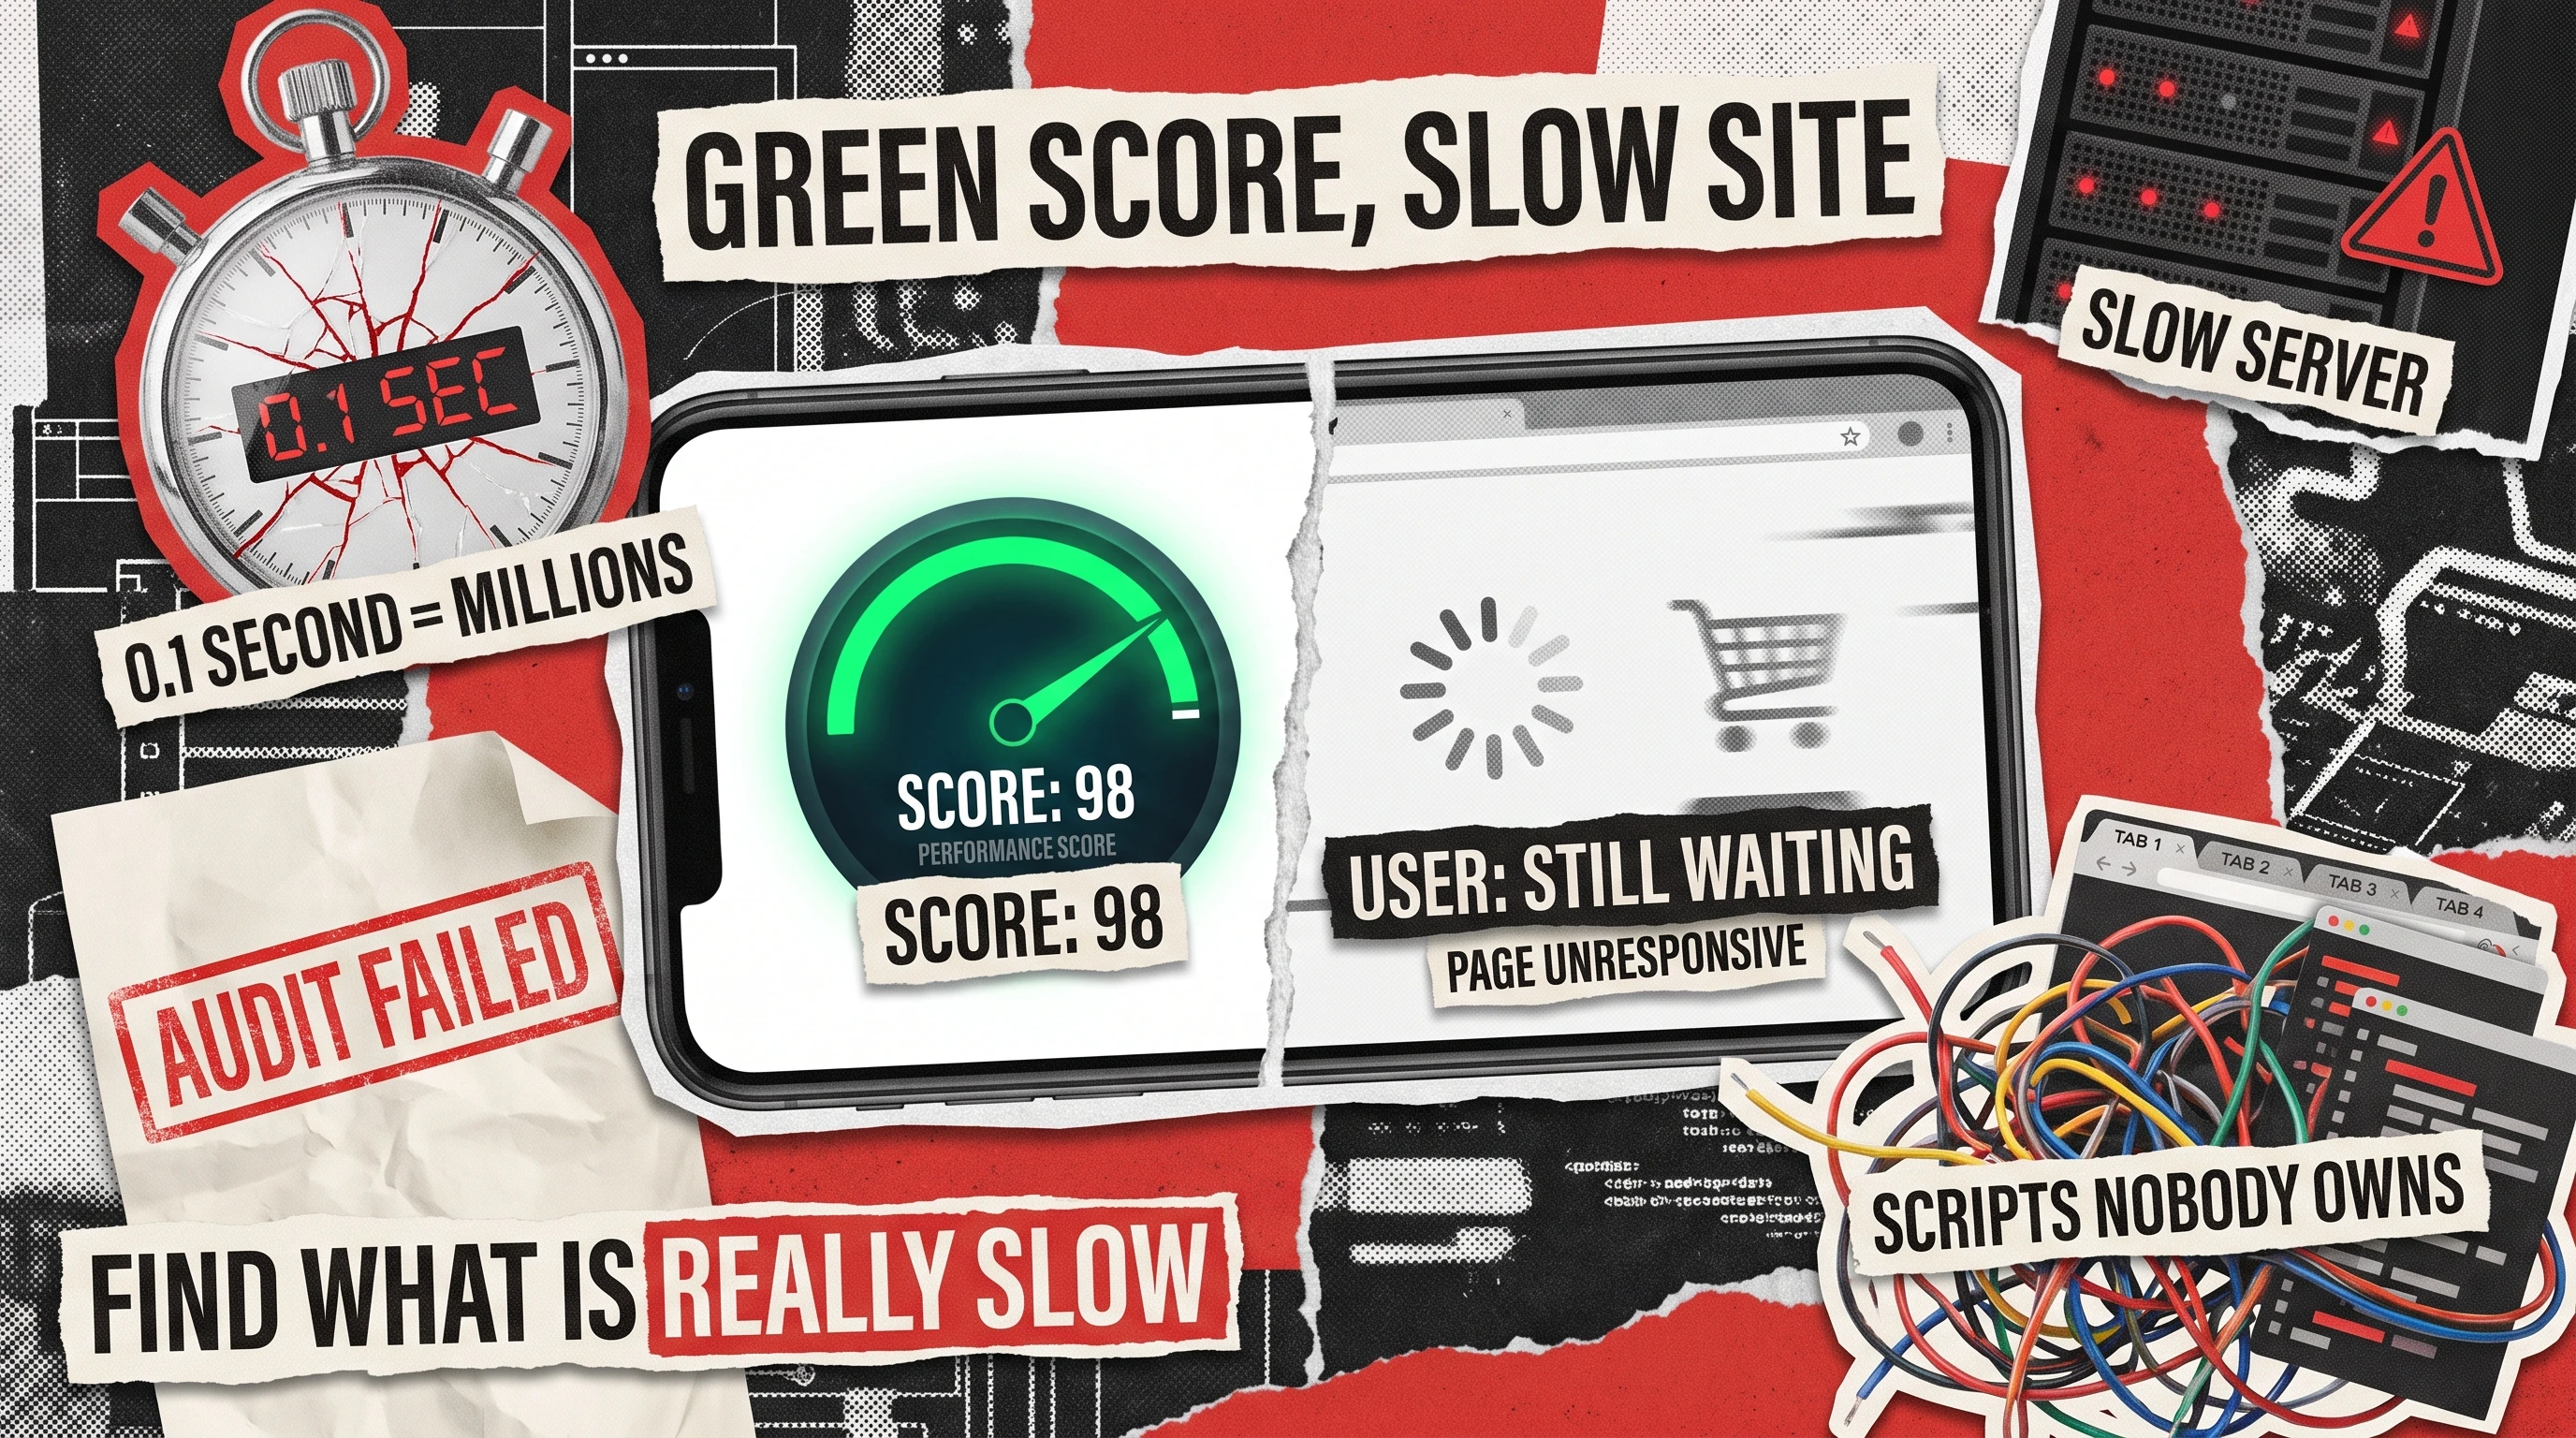
Your site feels slow, and you have a decision to make. You can keep guessing at fixes, or you can find out what is actually costing you conversions before you spend a sprint on the wrong thing.
A web performance audit is a structured diagnosis of what makes a website slow. It measures real user experience, server response, asset weight, and third-party load, then ranks each bottleneck by how much it hurts speed and revenue. The output is a short, ordered list of where to spend engineering hours, and where not to.
The stakes are measurable. A 2025 retail website performance benchmark covering the world’s fifty largest retailers found that one retailer generating more than $50 billion a year takes 9.4 seconds to load its homepage, and is potentially losing between $3.4 billion and $24.1 billion annually in missed conversions because of it. Speed is money moving through your funnel, and a slow page quietly leaks it every day.
Why Most Web Performance Audits Stop at the Scorecard
Most teams run a free tool, see a green number, and move on. That green number is where the real work should begin. A high Lighthouse score measures a single simulated load on a fast machine in a data center, which rarely matches the phone your customer is holding on a slow mobile connection.
The gap between the two shows up in the data. According to the HTTP Archive Web Almanac 2025, only 48% of mobile origins pass all three Core Web Vitals, against 56% on desktop, and loading speed is the metric sites fail most. A polished lab score can sit on top of field data that tells a very different story, which is how an audit that ends at the scorecard still ships a slow site.
We see this pattern constantly when we take over a stalled build. The previous team optimized for the tool, tuned the homepage for the slide deck, and left the checkout flow, the logged-in dashboard, and mobile untouched. An audit worth running looks at the journeys that carry revenue, on the devices your users actually have.
What a Site Performance Audit Checks
A thorough audit works in layers, from the symptoms your users feel down to the systems that produce them. Each layer answers a different question, and skipping one is how teams end up tuning something that was never the real constraint. The three areas below are where nearly every genuine bottleneck hides.
Core Web Vitals, the User-Facing Symptoms
Core Web Vitals are Google’s three field metrics for how a page feels to a real person. Largest Contentful Paint (LCP) measures loading, and Google treats 2.5 seconds or less as good. Interaction to Next Paint (INP) measures responsiveness, with a 200 millisecond target. Cumulative Layout Shift (CLS) measures visual stability, and content that jumps around while the page loads scores badly.
These are symptoms rather than causes, and that distinction changes how you read them. A poor LCP tells you the page feels slow to load, but on its own it will not say whether the culprit is a bloated hero image, a slow server, or a render-blocking script. In the 2025 field data, LCP is the metric mobile sites fail most often, so loading speed is usually where a good audit starts digging.

Server Response and Asset Weight
Before a browser can paint anything, it has to hear back from your server. Time to First Byte (TTFB) captures that wait, and a slow one poisons every metric downstream because nothing else can begin until the first byte arrives. Common causes include unindexed database queries, an origin with no caching layer, and a server sitting in one region while your users are in another.
Asset weight is the other half of this layer. Oversized images, uncompressed fonts, and megabytes of JavaScript all have to travel down a mobile connection before the page becomes usable. When the wait traces back to hosting, capacity, or configuration rather than code, a front-end review turns into an IT infrastructure audit, which looks at the servers, pipelines, and cloud spend underneath the site.
Render-Blocking Resources and Third-Party Scripts
Even with a fast server and light assets, a page can stall because the browser has been told to wait. Render-blocking CSS and JavaScript force the browser to download and process files before it shows anything, so a single large stylesheet or a synchronous script in the document head can freeze an otherwise quick page. The remedy is usually deferring, splitting, or inlining only what the first view genuinely needs.
Third-party scripts are the quieter offender. Analytics tags, chat widgets, A/B testing tools, and ad pixels each open connections and run code you do not control, and they tend to pile up because nobody owns removing them. A disciplined custom web development team can often claw back a second or more simply by auditing which tags still earn their place and loading the rest asynchronously.
How to Audit Website Performance
Knowing how to audit a website comes down to a repeatable method rather than a favorite tool. The goal is to measure honestly, trace each slow metric back to its root cause, and prove the fix worked before calling it done. The two steps below turn a pile of numbers into a plan you can hand to an engineering team.
Measure with Both Lab and Field Data
Lab data comes from a controlled test, such as Lighthouse or WebPageTest running a page under fixed conditions. It is repeatable and great for debugging, because you can change one thing and rerun the same test. The catch is that it represents one machine on one connection, so a lab score on its own can mislead you.
Field data comes from real users, collected through the Chrome User Experience Report or your own real user monitoring. It captures the full spread of devices, networks, and locations your audience brings, including the slow ones. A credible audit reads both together, using field data to decide what matters and lab data to work out why.
Trace, Prioritize, Verify
Once you have numbers, the work becomes disciplined detective work. Each slow metric gets traced to a concrete cause, ranked by impact, and confirmed after the change. In practice that looks like this:
- Trace. Open the browser performance trace and follow the slow metric to its source, whether that is a long server wait, a heavy script, or an image that loads late.
- Prioritize. Rank fixes by user impact against engineering effort, so a one-line caching header that saves 400 milliseconds beats a two-week refactor that saves 50.
- Verify. Ship the fix, then re-measure in the field over the following weeks, because a change that shines in the lab can do nothing for real users.
This loop is where an honest audit earns its keep. It replaces opinion with evidence and stops a team from burning its best hours on a change that felt important but moved no metric.
Common Culprits and Their Fixes
After enough audits, the same offenders show up again and again. The table below maps the culprits we find most often to the fix that usually clears them, along with the metric each one tends to wreck. It is a fast way to recognize your own site in the list before a single line of code changes.
Unoptimized images
LCP, total page weight
Serve modern formats such as WebP or AVIF, resize to display size, lazy-load anything below the fold
Render-blocking JavaScript
LCP, INP
Defer or split scripts, inline only critical code, delete unused bundles
No caching or CDN
TTFB, repeat-visit speed
Add browser and edge caching, serve static assets from a CDN close to users
Too many third-party scripts
INP, total load
Audit every tag, drop what is unused, load the rest asynchronously
Slow database queries
TTFB
Add indexes, cache expensive queries, fix N+1 query patterns
Layout shift from late assets
CLS
Reserve space for images and ads, preload fonts, stop injecting content above existing content
A pattern runs through those fixes. Most of the speed a normal site loses is handed back by removing weight and waiting less, before anyone rewrites the application. The audit exists to tell you which of these rows is actually costing you, so you fix in order of impact instead of working down a generic checklist.
When the Bottleneck Sits Below the Front End
Sometimes the front end is innocent. You compress every image, defer every script, and the site is still slow, which is the signal that the constraint lives deeper in the stack. This is the layer teams most want to avoid opening, because the fixes cost more than a caching header.
Below the front end, the usual suspects are an overloaded database, a monolith that cannot scale horizontally, synchronous calls to slow services, and an architecture that was fine at launch traffic but buckles under real load. These are design questions rather than tuning questions, and they are the same ones we work through when we plan scalable software architecture for a growing product. A load test that mimics a traffic spike will usually expose them faster than any single-page score.
When the evidence points this deep, the fix belongs to architecture, and the right next step is a broader software development audit that reviews the codebase, data model, and infrastructure together, so you solve the cause once rather than patching the symptom every quarter. Candor here saves money, because rewriting a query is cheap and rebuilding a platform under emergency load is expensive.
Symptoms Today, Systems Tomorrow
A performance problem you fix today is a systems question you answer for tomorrow. Every finding is also a signal about how your product is built and where it will strain as you grow. The teams that treat speed as a recurring practice, rather than a one-time cleanup before launch, keep their sites fast as traffic and features pile on.
The practical move is to run an audit before you assume you need a rebuild, and to run it again after every major release. Measure what your real users feel, trace each slow metric to its cause, and fix in order of impact. That habit turns performance from a fire you fight into a property you own.
If your site feels slow and you want a senior team to find the real cause before you spend a quarter guessing, get in touch with us and we will help you read the numbers and fix what actually matters.
FAQ
What is included in a web performance audit?
A performance audit covers four layers: real user field metrics such as Core Web Vitals, server response time, asset weight and delivery, and third-party scripts. A thorough one also load-tests the backend and reviews the architecture, then hands you a prioritized list of fixes ranked by their impact on speed and revenue.
How long does a website performance audit take?
For a typical mid-sized site, a focused review takes three to five business days: a day or two to gather lab and field data, a couple of days to trace root causes, and a session to prioritize fixes. Deep backend or architecture load testing can add one to two weeks.
How often should you run a performance audit?
Run a full audit at least once or twice a year, plus a lighter check after every major release, redesign, or new third-party integration. Continuous real user monitoring in between catches regressions early, so a slow page never surprises you during your busiest week.
Why is my site slow if my Lighthouse score is high?
A high Lighthouse score reflects one simulated load on a fast machine, while your visitors are on real phones and networks, so their field data often looks worse. Slow servers, heavy third-party scripts, and logged-in pages that Lighthouse never tests are the usual reasons the two disagree.
See how we helped AWE Learning migrate from on-premises to a scalable cloud SaaS that stayed fast and reliable as its audience grew beyond the USA