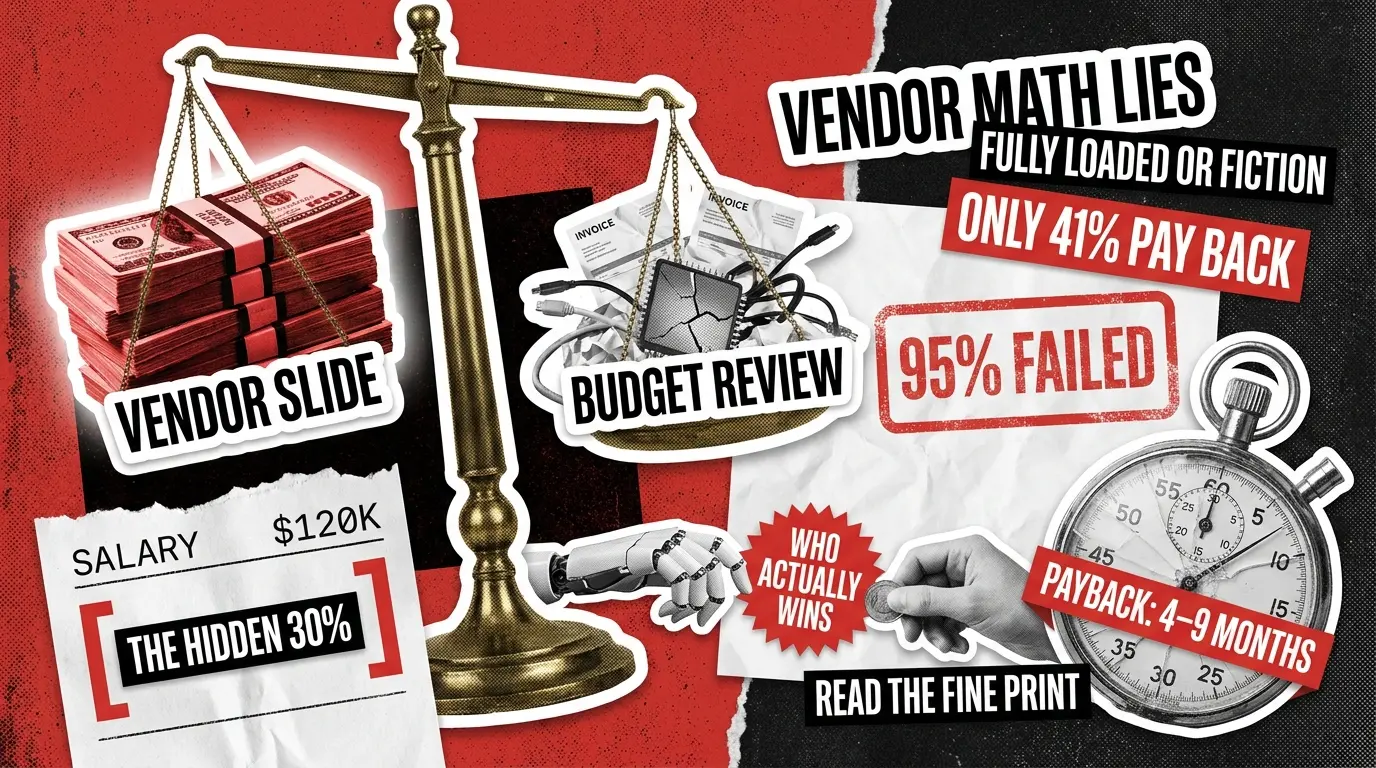
“Replace the team with AI” reads great on a slide and falls apart in the budget review. The vendor math leaves out build cost, maintenance, and the deployments that never pay back. The traditional staffing math anchors on salary and ignores the 30 percent that sits behind it. Both versions collapse the moment a CFO asks for the assumptions in writing.
The honest comparison sits somewhere in the middle, and the gap is wider than most decks admit. AI agents can cut per-task cost dramatically for the right workloads. A meaningful share of agent programs miss their first-year targets anyway. Both facts hold at the same time, and the distance between them is where every serious agentic AI workforce transformation decision actually lives.
What follows is the version of the math that survives a budget meeting: payback by function, the failure rate vendors leave out, and the build conditions that decide which side of the distribution you land on.
Why Most AI Agent vs Human Employee Cost Comparisons Mislead
Most published comparisons of AI agent vs human employee cost distort the math in two ways.
The first is asymmetric framing. The vendor side gets quoted as raw API token cost. The human side gets fully loaded with benefits, overhead, and management time. That asymmetry inflates apparent savings significantly before any production deployment exists. Real agents in production carry evaluation, integration, orchestration, and maintenance costs that demo decks rarely itemize.
The second is selection bias. Case studies feature the wins. They rarely mention how many programs in the same cohort missed payback. Real savings exist for the leaders in the distribution and look very different from the median.
Even at the technology frontier, the picture is not one-directional. Nvidia’s vice president of applied deep learning recently told Fortune that for his team, compute cost currently runs above employee cost. Whether AI is cheaper depends entirely on workload, task volume, and build quality. There is no universal cost advantage either way, only specific cases where one side wins clearly.

The Fully-Loaded Cost of a Human Employee
Before any agent build can be priced honestly, the human baseline has to be real. Salary represents roughly 70 percent of what a person actually costs an employer. The rest hides in benefits, taxes, overhead, and the gap between paid hours and productive ones.
What's Inside the 1.3–1.4x Salary Multiplier
The Bureau of Labor Statistics tracks this directly. In its June 2025 Employer Costs for Employee Compensation release, wages and salaries accounted for 70.2 percent of private-industry compensation. Benefits made up the remaining 29.8 percent. Total compensation averaged $45.65 per hour worked, of which $13.58 sat outside the salary line.
Inside that benefits share are payroll taxes including the 7.65 percent FICA contribution, health insurance and retirement contributions, paid leave, workers’ compensation, and unemployment insurance. Most finance teams layer additional cost on top for equipment, software licenses, facility allocation, and the share of management time spent supervising the role. Applied across roles, the combined multiplier typically lands between 1.3 and 1.4 times base salary for knowledge work, with higher figures in regulated industries.
The other half of the calculation is productive hours. A salaried employee paid for 2,080 hours per year delivers significantly fewer once PTO, training, meetings, and administrative overhead are subtracted. Fully loaded hourly cost divides total annual cost by productive hours, which is the figure that belongs in any honest comparison.
Fully-Loaded Cost and Hourly Rate, by Role
Applied to common roles in the US market using BLS multipliers against publicly reported median salaries, the math looks like this:
Customer service agent
~$45,000
~$63,000–$72,000
Marketing operations specialist
~$75,000
~$105,000–$120,000
Data analyst
~$85,000
~$119,000–$136,000
Mid-level software engineer
~$130,000
~$182,000–$220,000
These are the numbers an AI agent has to beat for the business case to close. Per-task economics need this baseline, otherwise the comparison drifts toward fiction.
The Real Total Cost of Ownership of an AI Agent
The agent side carries three cost layers that most total cost of ownership (TCO) models compress into a single subscription line. Treating them separately is the only way to make the comparison defensible. AI agent total cost of ownership includes build, run, and maintenance, and each behaves differently across the asset’s life.
Build, Run, and Maintenance: the Three TCO Layers
Build cost is one-time and amortized over the agent’s useful life. Scope drives the figure heavily. A narrow internal agent built on rules plus an LLM, with minimal integration, sits at the low end. A production-grade agent with retrieval, real integrations into business systems, and a proper evaluation harness costs significantly more. Enterprise multi-agent systems with governance, audit trails, and human-in-the-loop infrastructure sit at the high end. Within these builds, integration engineering and quality assurance consistently dominate the total, far more than the model layer itself.
Run cost is the recurring monthly burn, with several layers:
- LLM API calls that scale with task volume
- Vector database and retrieval infrastructure
- Monitoring, observability, and evaluation tooling
- Cloud compute, storage, and bandwidth
Maintenance is the line item that breaks budgets. Models drift, prompts need updating, upstream APIs change and break integrations, and new data requires retraining. Industry practice treats annual maintenance as a meaningful percentage of the original build cost, frequently in double digits. Programs that budget for build and ignore maintenance routinely overspend in year two.
Agent vs Human Cost per Task, by Function
The per-task numbers can be dramatic for the right workloads. A peer-reviewed 2025 study published on arXiv measured open-source agent frameworks against human workers across digital labor tasks. Human workers charged an average of $24.79 per task. Agents powered by frontier models completed the same tasks at $0.94 to $2.39, representing cost reductions of 90 to 96 percent.
The variance matters. Standardized knowledge work clusters at the high end of that reduction range. Tasks where mandatory human review re-enters the loop, such as contract review or regulated decisions, compress the gap significantly because attorney or specialist time gets added back regardless of agent quality. The right question is never “how much can AI save us in general,” it is “which specific workflows fall inside the range where the agent math closes.”
Agentic AI ROI: Payback Windows and the Failure Rate Nobody Talks About
The flip side of per-task economics is the payback question every finance lead eventually raises. Agentic AI ROI behaves predictably by function, with one large caveat most articles avoid: a meaningful share of deployments never pay back.
Median Payback by Function: 4 to 9 Months
Independent benchmarks converge on similar payback windows for the workloads where AI agents work well. McKinsey’s 2025 State of AI research found that organizations capturing measurable cost reductions concentrated those gains in customer service, marketing, and software engineering. Customer service deployments tend to pay back fastest because volume is high and tasks are repetitive. Marketing operations and engineering follow, with longer windows where integration and evaluation work add to the timeline. Back-office finance and HR automation pay back slower because integration complexity dominates the project.
The pattern is consistent across studies. Where workload matches the agent’s strengths (high volume, structured input, clear success criteria), payback sits inside a year. Where the workload requires judgment, novel reasoning, or heavy human oversight, payback stretches or never arrives.
Why Only 41% of Rollouts Hit ROI in Year One
The harder story sits in the failure data. A 2025 MIT study widely covered in technology media found that approximately 95 percent of generative AI pilots failed to produce measurable financial return. Within enterprise agent deployments specifically, vendor and analyst data consistently shows that less than half of programs hit positive return inside the first year. The AI agent failure rate in production deployments runs well above what marketing case studies suggest.
The reason is rarely model capability. Unmeasured rework absorbs a large share of self-reported time savings: an agent drafts an email, a human silently corrects a fact, and the productivity metric never reflects it. The same pattern shows up in code, customer responses, and research summaries. Gross savings look fine while net savings disappear into invisible cleanup.
The other two causes are evaluation drift, where an agent performs in pilot and degrades in production as real users surface edge cases, and integration fragility, where an upstream API change silently breaks a workflow. Both are engineering problems rather than AI problems.
AI Agent ROI Calculator: Use Your Own Numbers
Industry averages orient the conversation. They are wrong for any specific situation. An AI agent ROI calculator built around your actual task volume, salary band, and target deployment scope produces a defensible number for a real investment decision.
The variables that matter are current monthly task volume, fully loaded cost per task on the human side using your BLS-derived hourly rate, expected agent resolution rate (genuine resolution, not deflection), a rework haircut applied to gross savings (a conservative assumption for year one), and amortized build cost spread across the asset’s expected life. Running these against a 12 to 24 month payback window produces a figure that holds up under scrutiny.
The output worth taking into a budget conversation is a payback range, a net annual saving figure at year two, and a sensitivity analysis showing what happens if resolution rate lands below projection. A defensible agentic AI workforce transformation plan starts with this exercise run per workflow, before any agent is built.
Where AI Agents Win, Where Humans Still Do
The pattern across deployments is consistent. AI agents win decisively on volume, repetition, and structured information processing. They struggle with judgment, novel problem-solving, and high-stakes situations where the cost of being wrong is high enough that mandatory human review re-enters the loop and erases the saving.
Two rules survive most decision conversations. If the task is high-volume and rules-clear, the agent math closes. If the task is low-volume or judgment-heavy, the math almost never does. The comparison only counts when both sides are fully loaded. Benchmarking API token cost against a salary line item is sales, not analysis.
The harder question is rarely whether AI agents are cheaper in the abstract. It is whether your specific workflow sits inside the range where the cheaper number actually materializes in the P&L.
Why the Math Only Works If the Build Is Right
Successful production deployments and failed ones are separated by build quality more than by model choice. Four conditions appear in nearly every program that lands inside the winning half of the distribution.
Production-grade evaluation infrastructure measures agent output continuously and catches drift before it eats into savings. Real integration with business systems where work actually happens, including CRM, ticketing, and knowledge stores, replaces a bolted-on chat layer that demos well and fails in production. Governance and human-in-the-loop checkpoints get calibrated to the cost of being wrong, with clear escalation paths. Monitoring surfaces silent failures, integration breakage, and prompt regressions within hours rather than weeks.
Off-the-shelf “AI employee” subscriptions almost never meet these conditions. They were scoped for demos, which have very different requirements from production deployments serving thousands of users. Production-grade builds typically take months with a team that has shipped agent systems before, which is why serious custom AI agent development looks closer to engineering investment than tooling purchase.
What to Take into Your Next Board Meeting
The honest comparison fits on a single slide. Bring fully loaded numbers on both sides with no asymmetry between API cost and salary cost. Bring a payback range specific to the workload rather than a generic ROI multiplier. Bring the failure rate alongside the savings rate so the full distribution shows. And bring the build quality conversation, because that is the variable that decides which side of the distribution you land on.
Teams that approach the comparison this way tend to make decisions that hold up six months later. Teams that lead with vendor numbers tend to revisit them under uncomfortable circumstances. If you are scoping a build and want a defensible payback model rather than a sales projection, contact us for an analysis grounded in your actual workload.
FAQ
How much does it cost to replace employees with AI agents?
The honest answer depends on the workload. Peer-reviewed research on open-source agent frameworks measured human workers charging around $24.79 per task on average versus $0.94 to $2.39 for agents on digital labor tasks, a 90 to 96 percent reduction. That gap only holds for in-scope workloads. Build cost varies widely with scope, and annual maintenance adds a meaningful percentage of original build to year-two budgets.
What is the ROI of AI workforce transformation?
Independent benchmarks point to payback inside a year for in-scope workloads, particularly customer service, marketing operations, and software engineering. Three-year returns can be substantial for well-scoped deployments. The major caveat is implementation quality: a large share of programs miss year-one targets, almost always because of evaluation gaps and integration issues rather than model capability.
How often do AI agent deployments pay back at all?
Industry data shows less than half of enterprise agent rollouts hit positive ROI inside 12 months. MIT research covered widely in 2025 found roughly 95 percent of generative AI pilots failed to produce measurable financial return. Failures concentrate in programs that skipped evaluation infrastructure, attempted broad rollouts without piloting on contained workflows, or treated agent deployment as a tooling purchase rather than an engineering investment.
See how we helped Complete Network audit backend API and boost maintainability by 80%